
Fig. 4. SAVSNET antimicrobial prescription benchmarking portal engagement.
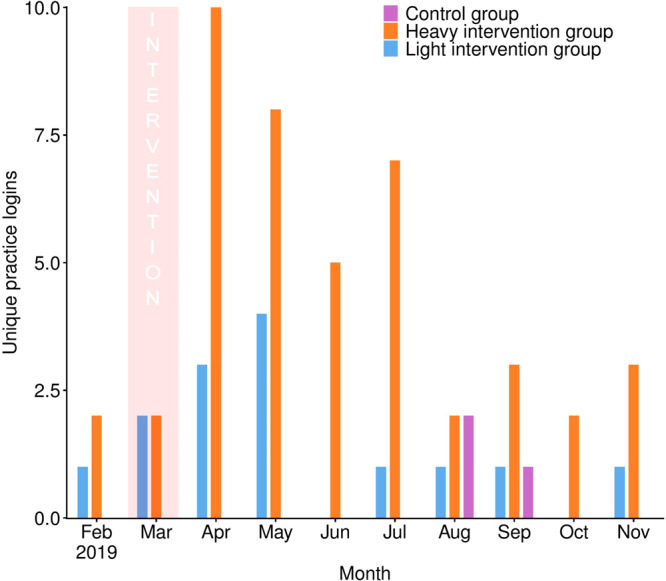
Number of practices logging into the SAVSNET antimicrobial prescription benchmarking portal by month (February–November 2019 inclusive) and intervention group. The purple boxes refer to findings from the control group (n = 20 practices); the blue boxes refer to the light intervention group (n = 20 practices), and the green orange boxes refer to the heavy intervention group (HIG, n = 20 practices). The pink shaded region shows the month at which the initial notification took place.