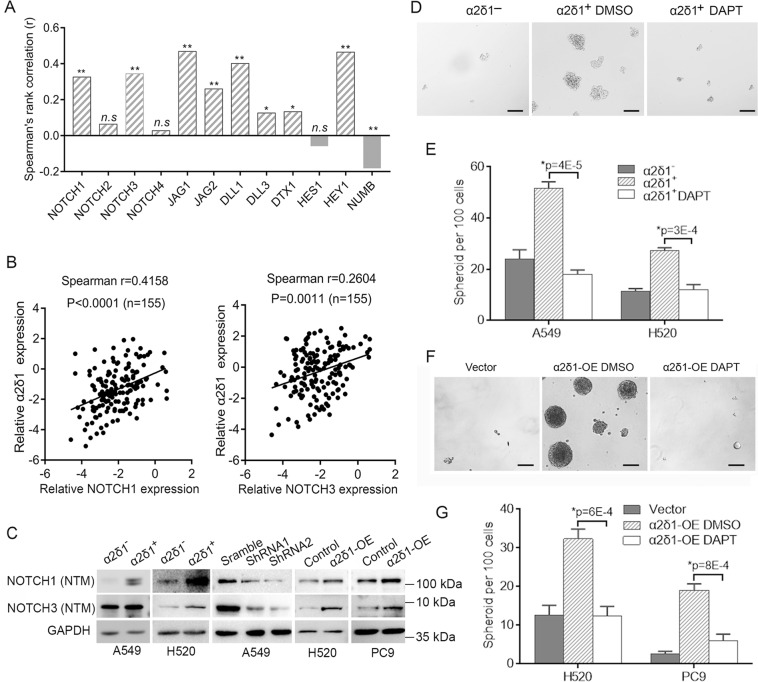
Fig. 5. The roles of α2δ1 in driving TIC capacities is dependent on Notch signaling.
A Histograms show the correlation of α2δ1 mRNA with the genes related to Notch signaling in NSCLC tissues (n = 349) from TCGA database. *p ≤ 0.05, **p ≤ 0.001, n.s.>0.05. B The correlation between the expression of α2δ1 and NOTCH1, and NOTCH3 was detected by qRT-PCR in clinical NSCLC samples. C Western blot analysis of the expression of NOTCH1 and NOTCH3 in both the α2δ1+ and α2δ1– subsets sorted from the indicated sources, purified α2δ1+ A549 cells with α2δ1 knockdown by shRNAs, and the indicated cells overexpressing α2δ1. D Phase-contrast photographs showing the spheroids formed by α2δ1−, or the α2δ1+ A549 cells treated with vehicle control DMSO or DAPT (10 µmol/L). Scale bars, 100 µm. E Histograms showing the spheroid formation efficiencies of the purified α2δ1−, or α2δ1+ cells from indicated sources treated with vehicle control DMSO or DAPT (10 µmol/L) (n = 3). F Representative phase-contrast micrographs demonstrating the spheroids formed by H520 cells overexpressing α2δ1 following DAPT treatment. Scale bars, 100 µm. G Histograms showing the spheroid forming efficiencies of the indicated cells overexpressing α2δ1 treated with vehicle control DMSO or DAPT (n = 3). The error bars in (E) and (G) represents SD of three independent experiments. *Student’s t-test.

