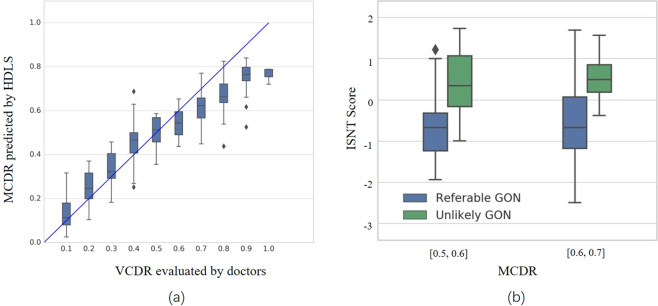
Fig. 4. Evaluation of efficacy of MCDR and ISNT score.
a Comparison of MCDR predicted by hierarchical deep learning system (HDLS) with VCDR evaluated by the glaucoma expert. b Comparison of ISNT score obtained by HDLS between referable GON and unlikely GON. The median (50th percentile) is represented by the horizontal centerline, and the 25th and 75th percentiles as the lower and upper limits of the box. The upper and lower horizontal bars represent the maximum and minimum values, respectively, of a 1.5 interquartile range. The diamond symbols represent outliers. Outliers were denoted in the figure because they resided outside of the 1.5 interquartile range. MCDR mean cup-to-disk ratio, VCDR vertical cup-disc ratio, ISNT inferior, superior, nasal, temporal; GON glaucomatous optic neuropathy.

