
Fig. 2. Imino chemical shift map of BP-triplets.
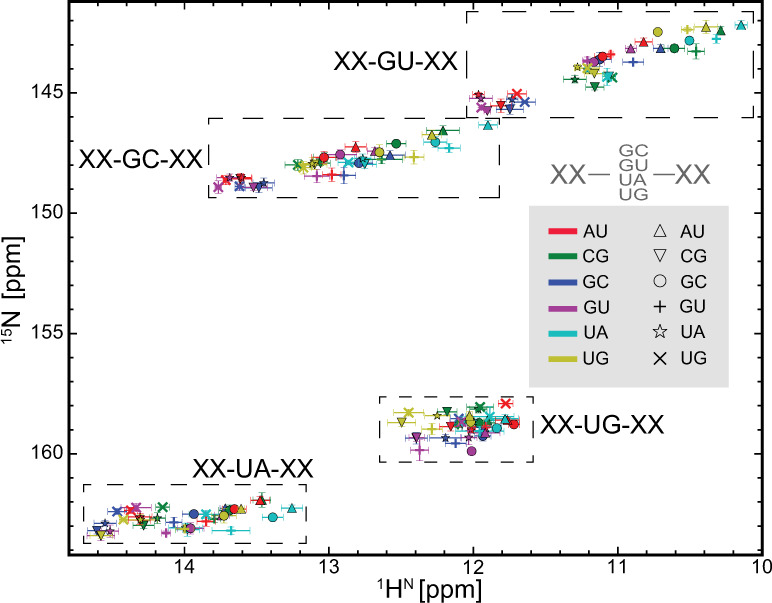
The average imino resonance of each BP-triplet is shown as a marker on the map. Each BP-triplet can be described as a triplet code (see Fig. 1a): the dashed boxes depict the chemical shift distribution range of the central guanine or uridine residue as defined by the first letter of the middle code; the 5′ and 3′ neighboring base pairs are defined by color and shape of makers, respectively. The error bars indicate one standard deviation (s.d.; the corresponding sample sizes are provided in Supplementary Table 2).