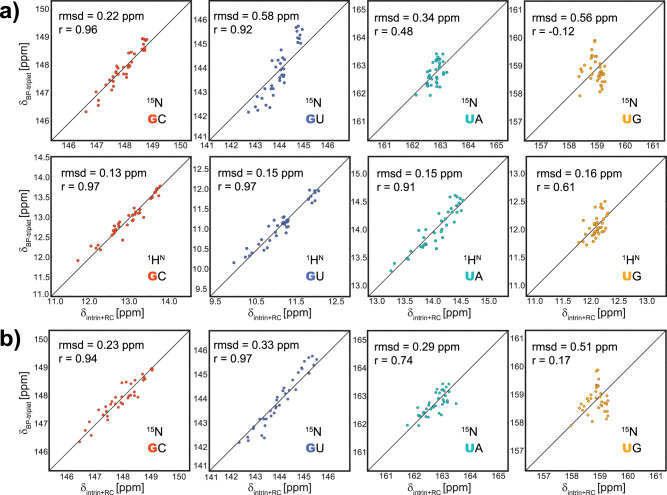
Fig. 3. Correlation between chemical shifts calculated by the semiempirical model and chemical shifts in the BP-triplet lookup table.
The structure models were generated by RNAComposer. Chemical shift data in the BP-triplet table are divided into four groups (GC: red; GU: blue; UA: cyan; UG: orange) according to types of the central base pair. a Correlation between chemical shifts calculated by the semiempirical model using original RC parameters (DC set) and chemical shifts in the BP-triplet lookup table. The upper four subplots show the correlation for 15N, and the lower four show the correlation for 1HN. b Correlation between 15N chemical shifts calculated by the semiempirical model using calibrated RC parameters and 15N chemical shifts in the BP-triplet lookup table. The semiempirical calculation was carried out by summing up the intrinsic chemical shift of the central base pair and RC contributions from two neighboring base pairs. For each subplot, the intrinsic chemical shift was adjusted so that the semiempirical result and the chemical shift data from the BP-triplet table give the same mean value.

