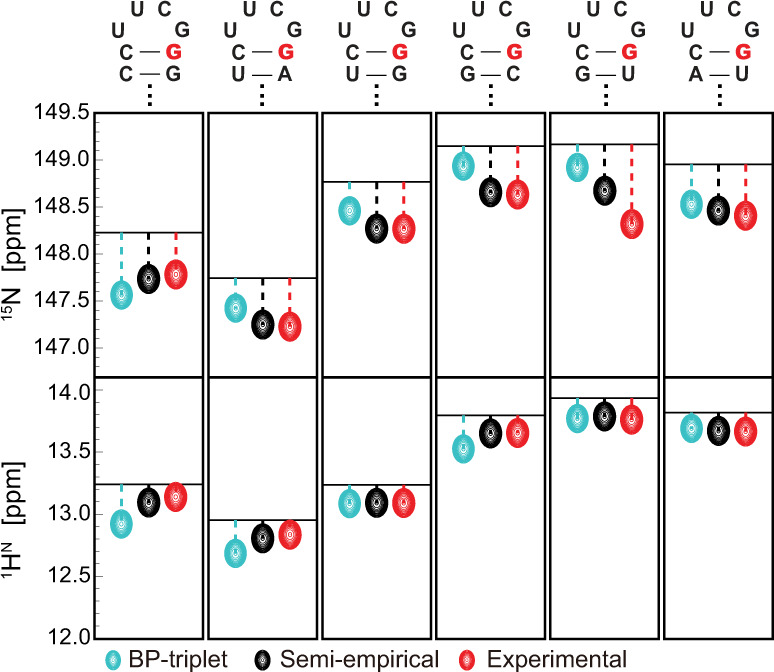
Fig. 5. Comparison of 15N (upper panel) and 1HN (lower panel) chemical shifts for the guanine in the CG closing base pair of UUCG tetraloops.

The secondary structures of UUCG motifs are shown on top of each panel, and the guanine of interest is highlighted in red. The horizontal line in each subplot marks the sum of chemical shift contributions from the central CG base pair and the base pair immediately below it. Resonances colored in cyan and black represent the total chemical shifts of the highlighted guanine by including the contribution from UUCG tetraloop through two approaches: prediction using the BP-triplet table (cyan); RC shift calculation using the calibrated parameter set (black). The resonances colored in red represent experimental values.
