Figure 2.
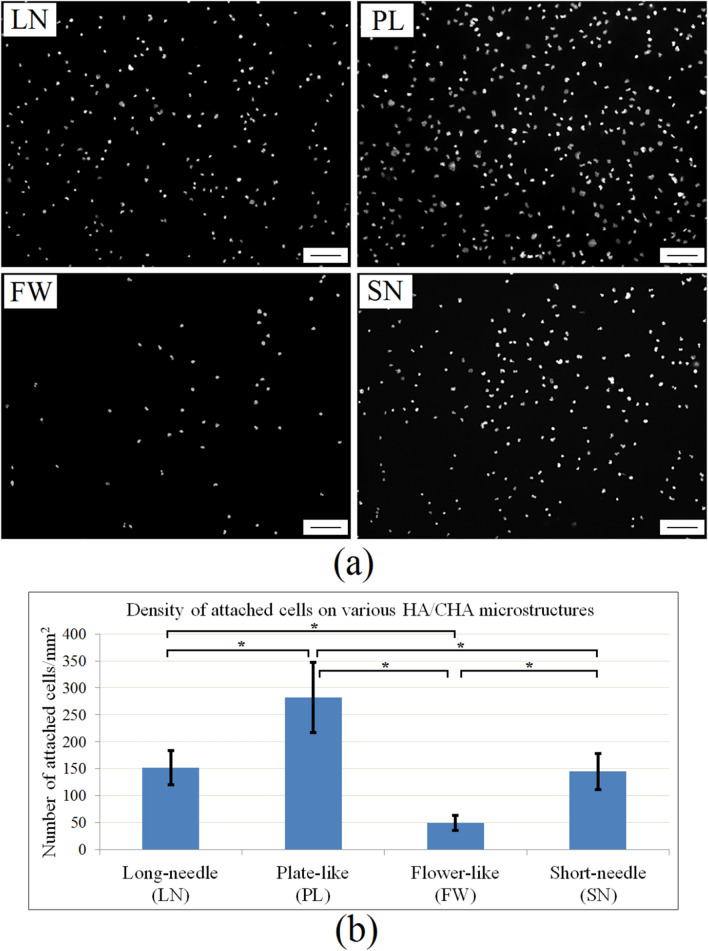
Number of cells attached to bioactive glass monoliths with different nanopore size and HA/CHA microstructure. Cell nuclei of MC3T3-E1 cells attached after 2 h to monoliths were stained with DAPI and imaged by fluorescence microscopy. (a) Representative black and white images of nuclei of attached cells on long-needle (LN), plate-like (PL), flower-like (FW), and short-needle (SN) HA/CHA-covered monoliths are shown (scale bar = 100 µm). (b) Density of cells attached onto the HA/CHA layer quantitatively determined by counting the number of cell nuclei per mm2 on multiple representative images/monolith type in three independent experiments. Significant differences in cell numbers are marked with *.

