
Figure 6.
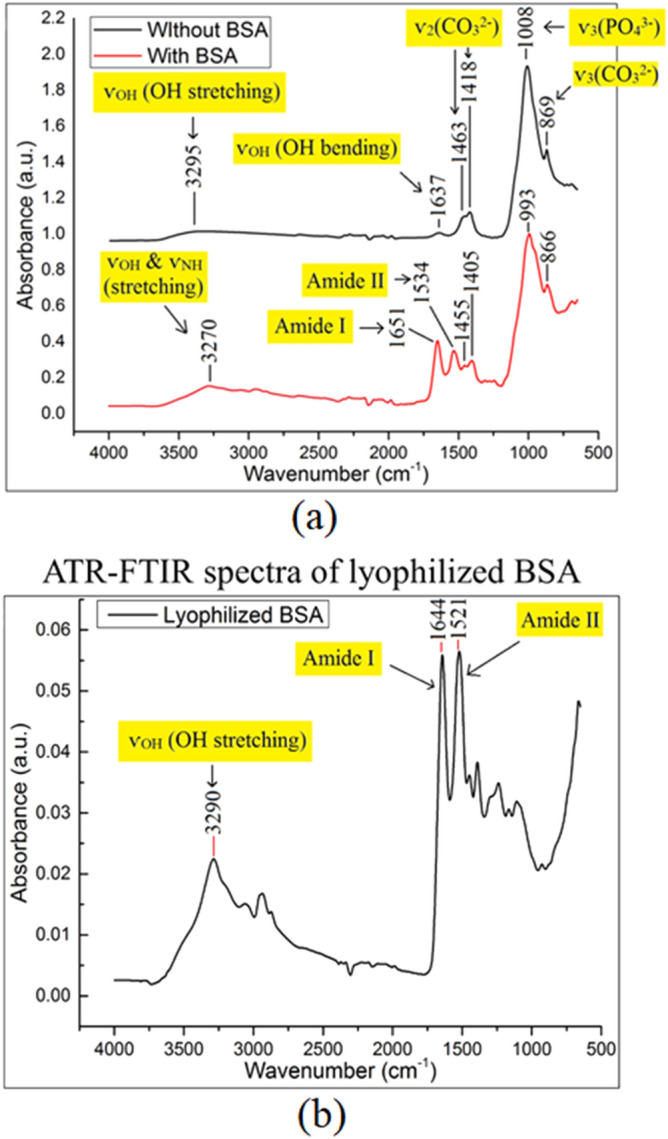
(a) Representative ATR-FTIR spectra of long-needle (LN) HA/CHA samples with (red) and without (black) 2-h BSA incubation. (b) Representative ATF-FTIR spectrum of lyophilized BSA acquired in control.
Official websites use .gov
A
.gov website belongs to an official
government organization in the United States.
Secure .gov websites use HTTPS
A lock (
) or https:// means you've safely
connected to the .gov website. Share sensitive
information only on official, secure websites.
(a) Representative ATR-FTIR spectra of long-needle (LN) HA/CHA samples with (red) and without (black) 2-h BSA incubation. (b) Representative ATF-FTIR spectrum of lyophilized BSA acquired in control.