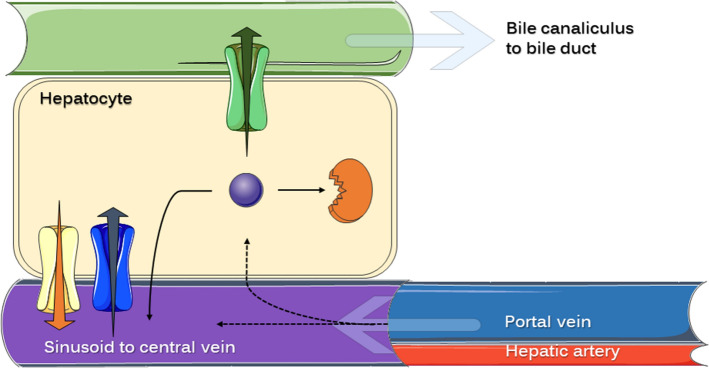
Figure 1.
Schematic representation of the different routes that a drug can follow during its passage through the liver. The hepatocyte environment is shown, emphasizing the presence of drug transporters (influx and efflux) at the different membranes and the spatial relation with blood and bile circulation. Either arriving from the portal vein or the hepatic artery, drug circulating in liver sinusoids can be active or passively transferred into the hepatocyte or keep circulating towards the central vein (systemic circulation). Black dashed arrows represent these transferences. Intracellular drug (violet sphere) will be suffer one of these processes: hepatobiliary secretion (active efflux represented by green transporters), enzyme-mediated biotransformation (orange structure representing intracellular metabolic enzyme) or transference back into sinusoidal blood (active or passive). Yellow structures with orange arrow represent efflux transporters at the basolateral membrane (such as MRP3 and MRP4), while blue structures with blue arrow represent influx transporters (such as OATP). Bile canaliculus convey in the bile duct delivering the fluid into the gallbladder. This figure was prepared using content from Servier Medical Art, licensed under a Creative Common Attribution 3.0 Generic License. http://smart.servier.com/.

