Figure 1.

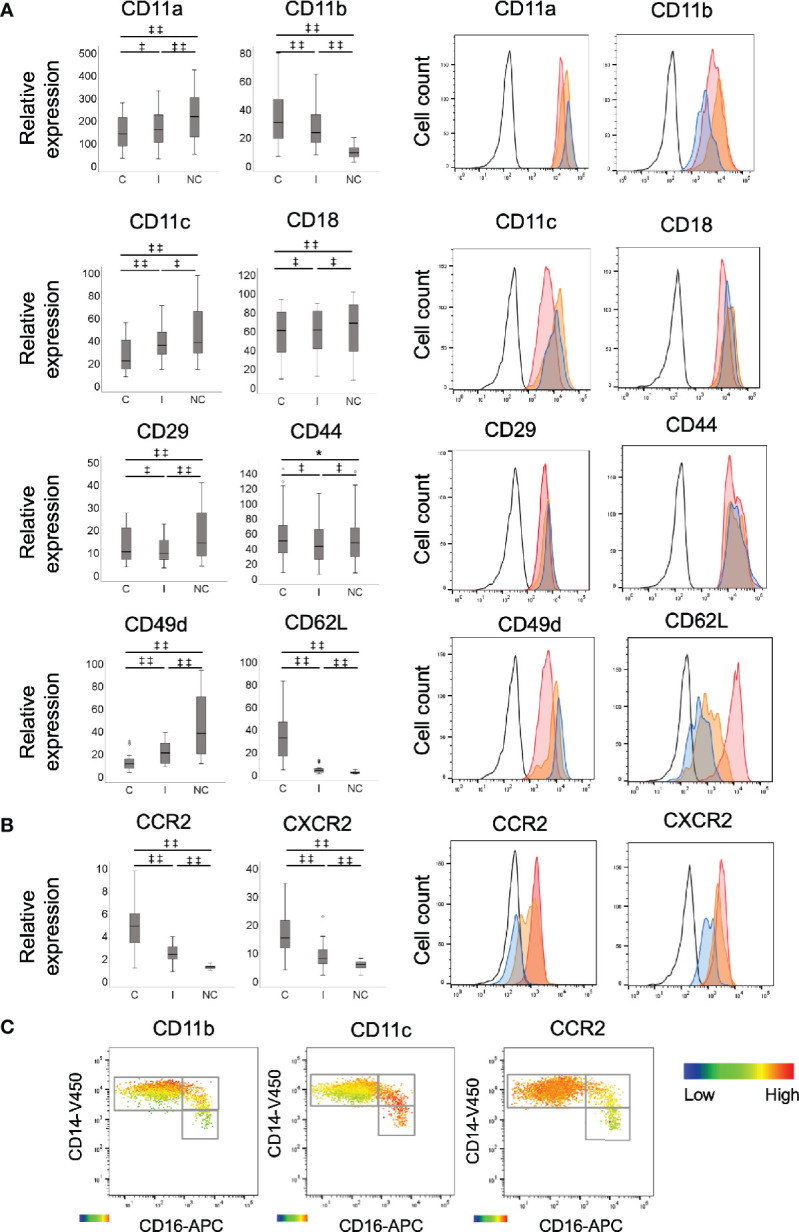
Comparison of recruitment marker expression between monocyte subsets. Expression of (A) adhesion molecules, CD11a, CD11b, CD11c, CD18, CD29 (all integrins), CD44 (selectin), CD49d (integrin) and CD62L (selectin) and (B) chemokine receptors, CCR2 and CXCR2 by monocyte subsets, measured by flow cytometry. C: classical; I: intermediate; and NC: non-classical, n=30. Data presented as box and whisker plots, with outliers denoted by circles and representative histograms. Black lined histograms: isotype control, red histograms: classical monocytes, orange histograms: intermediate monocytes and blue histograms: non-classical monocytes. The data were log transformed to appropriate normality and in order to stabilise the variance prior to analysis. Statistical calculations of significance were performed using repeated measures ANOVA for significant differences in the relative expression levels of the markers between any 2 monocyte subsets within subject, ‡‡p < 0.001; ‡p < 0.01; *p < 0.05. The differences between subsets were back transformed to provide fold changes (relative to the isotype control) and associated 95% confidence intervals (CIs). (C) Differential expression of recruitment markers on monocyte subsets. Heat map showing the degree of expression from high (red) to low (blue) of integrins, CD11b and CD11c and chemokine receptor, CCR2 on whole blood monocyte population based on CD16 and CD14 expression. The heat maps represent classical, intermediate and non-classical monocytes, respectively. The heat maps were created using Flow Jo software.
