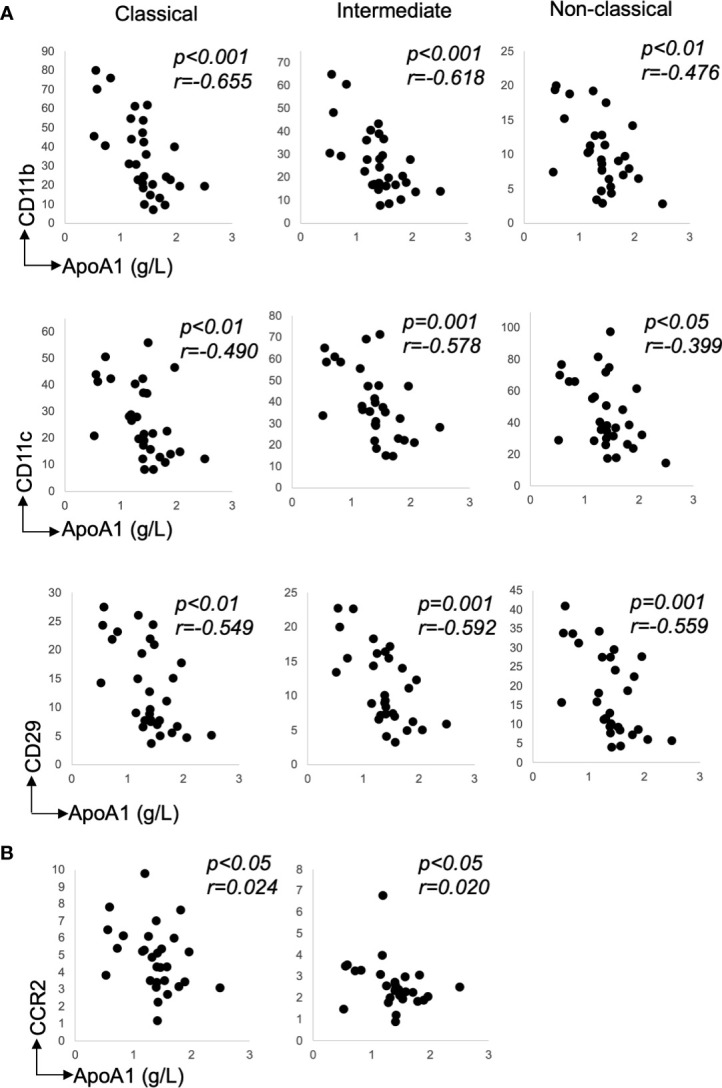
Figure 3.

Recruitment marker expression relative to lipid levels. (A) Classical, Intermediate and Non-classical correlations for chemokine receptor, CD11b, CD11c, and CD29 with ApoA1, n=30 (B) Classical and Intermediate correlations for chemokine receptor, CCR2 with ApoA1, n=30. Data presented as scatter plots. The statistical significance of correlation was determined by Spearman’s rank correlation. All tests were two-tailed. r represents correlation coefficient; p represents level of significance and N.S. represents non-significant.
