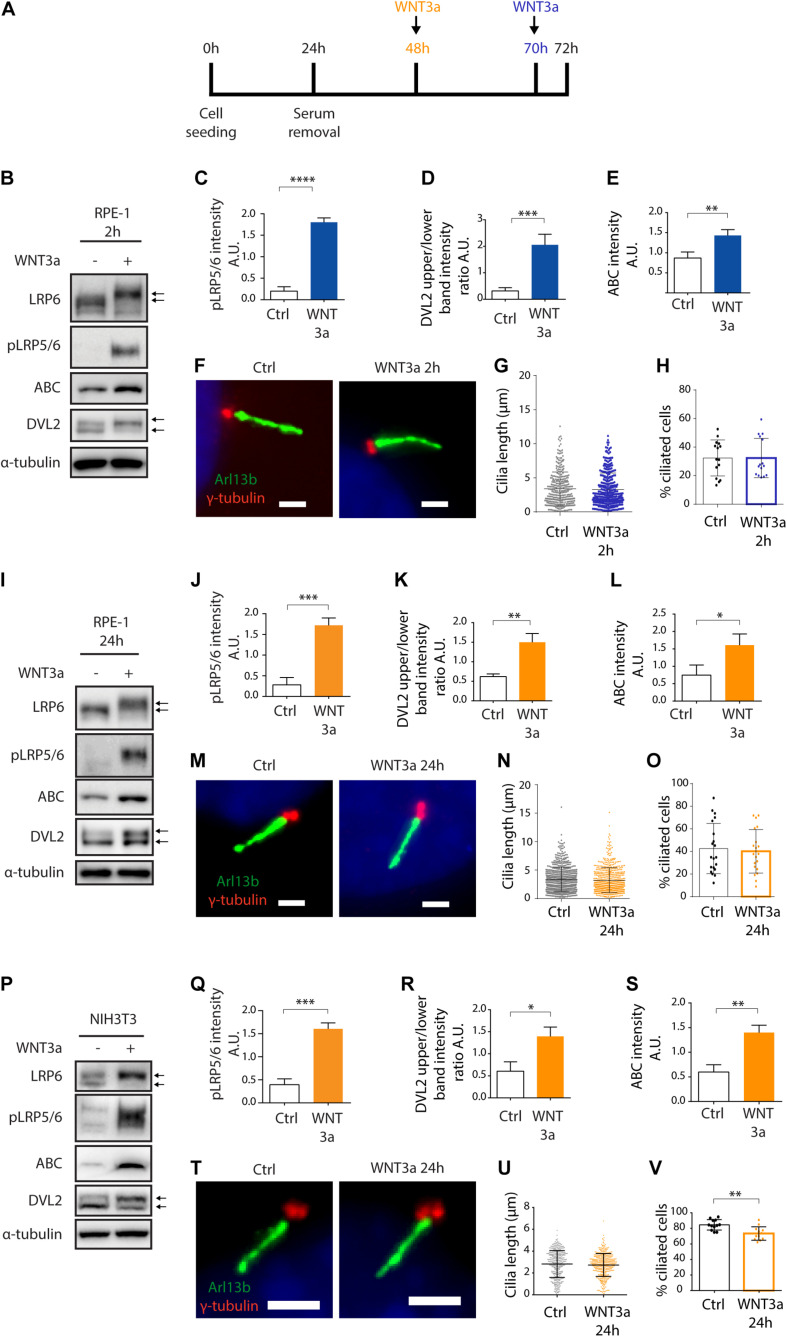
FIGURE 1.
WNT3a does not promote ciliogenesis or cilia length. (A) Experimental scheme of WNT3a treatment experiment. Cells were seeded and grown for 24 h, then starved for additional 48 h. A 2 h treatment (RPE-1) by WNT3a is indicated in blue, 24 h treatment is indicated in orange (RPE-1 and NIH3T3). (B) Western blot analysis of 2 h WNT3a treatment of RPE-1. The treatment leads to LRP6 shift and increased LRP5/6 phosphorylation, DVL2 phosphorylation and upshift, and accumulation of ABC. The quantitation of pLRP5/6 intensity is shown in (C) n = 3, DVL2 band intensities (upper to lower band intensity ratio, the bands are indicated by arrows) is shown in (D) n = 3, the quantification of relative ABC levels is presented in (E) n = 3. (F) Representative images of RPE-1 cells treated by WNT3a or vehicle (control) for 2 h and stained for Arl13b (green) and γ-tubulin (red). Scale bar = 2 μm. DAPI (blue) was used to counter stain nuclei. The corresponding quantification of the cilia length (G) and the percentage of cells with Arl13+ cilium (H). Each dot indicates either length of a single primary cilium (G) or percentage of ciliated cells in a single image (H). (I) Western blot analysis of 24 h WNT3a treatment of RPE-1. The treatment leads to LRP6 shift, increased LRP5/6 phosphorylation, DVL2 phosphorylation and upshift, and accumulation of ABC. The quantification of pLRP5/6 intensity is shown in (J) n = 3, DVL2 bands (indicated by arrows) intensity ratio is shown in (K) n = 3, quantification of relative ABC levels is presented in (L) n = 3. (M) Representative images of RPE-1 cells treated by WNT3a or vehicle (control) for 24 h and stained for Arl13b (green) and γ-tubulin (red). Scale bar = 2 μm. DAPI (blue) was used to counter stain nuclei. The corresponding quantification of the cilia length and the percentage of cells with Arl13+ cilium is shown in (N,O), respectively. Each dot indicates either length of a single primary cilium (N) or percentage of ciliated cells in a single image (O) n = 4. (P) Western blot analysis of NIH3T3 cells treated by WNT3a for 24 h shows LRP6 shift and LRP5/6 phosphorylation, DVL2 phosphorylation and upshift, and accumulation of ABC. The quantification of pLRP5/6 intensity is shown in (Q) n = 3, DVL2 band intensities (upper to lower band intensity ratio, the bands are indicated by arrows) is shown in (R) n = 3, quantification of relative ABC intensity (S) n = 3. (T) Representative images of NIH3T3 cells treated by WNT3a for 24 h, stained for Arl13b (green), and γ-tubulin (red). Scale bar = 2 μm. DAPI (blue) was used to counter stain nuclei. The corresponding quantification of the cilia length (U) and the percentage of cells with Arl13+ cilium (V). Each dot indicates either length of a single primary cilium (U) or percentage of ciliated cells in one image frame (V) n = 3.

