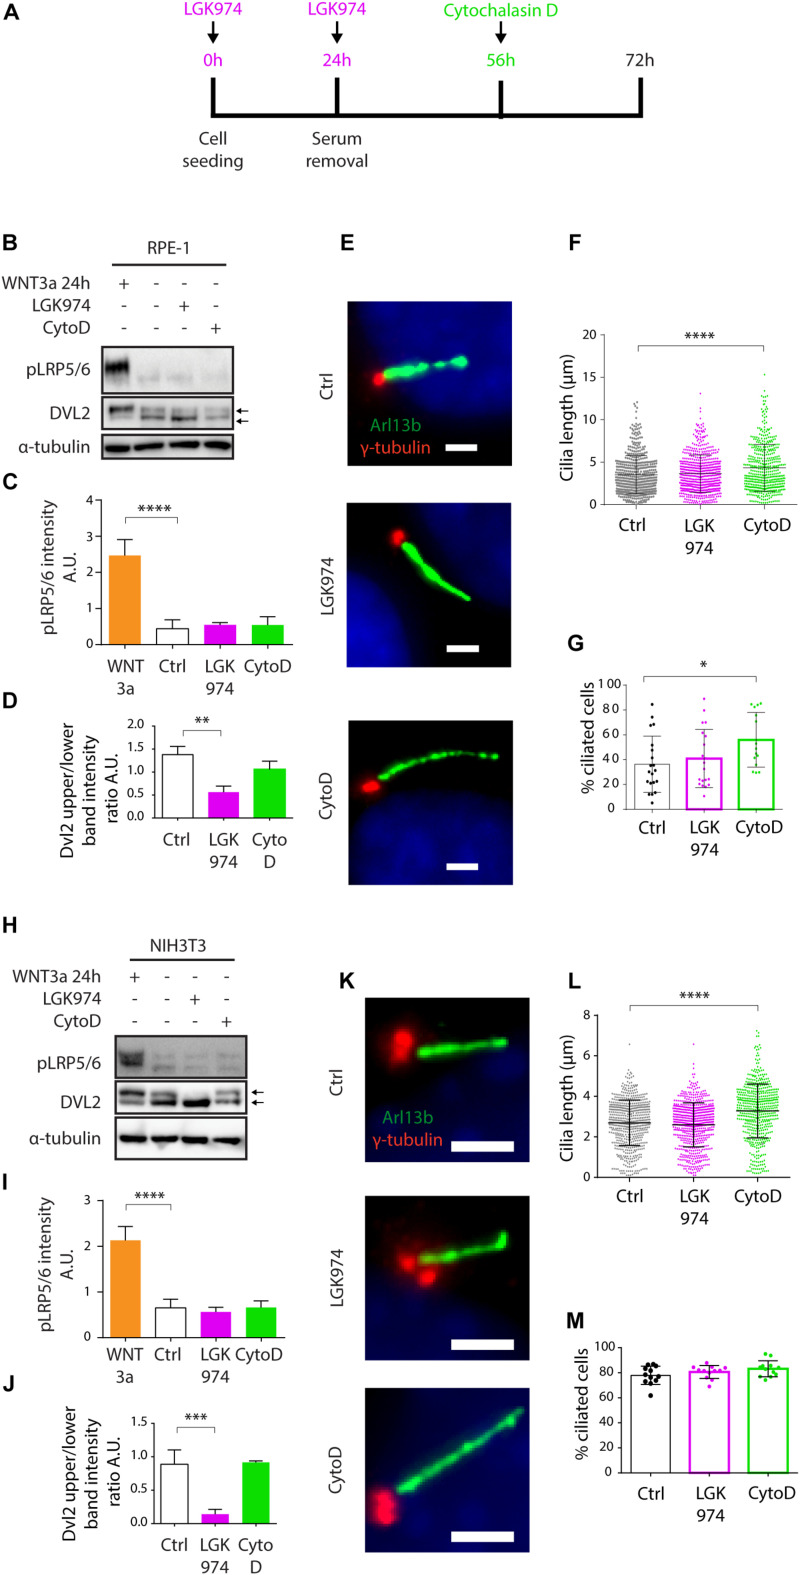
FIGURE 2.
Inhibition of WNT secretion has no effect on ciliogenesis or cilia length. (A) Experimental scheme illustrating the time points of LGK974 (Purple) or CytoD (Green) treatments. (B) Western blot analysis of RPE-1 treated by LGK974 or CytoD. WNT3a was used as positive control to activate WNT/β-catenin pathway. pLRP5/6 intensity is quantified in (C) n = 3, DVL2 shift (upper to lower band intensity ratio) is quantified in (D) n = 3. (E) Representative images of RPE-1 cells following the indicated treatment, stained for Arl13b (green) and γ-tubulin (red). Scale bar = 2 μm. DAPI (blue) was used to counter stain nuclei. Quantification of the cilia length (F) and the percentage of cells with Arl13+ cilium (G). Each dot indicates either length of a single primary cilium (F) or percentage of ciliated cells in one image frame (G) n ≥ 3. (H) Western blot analysis NIH3T3 treated by LGK974 or CytoD. pLRP5/6 intensity is quantified in (I) n = 3, (J) Quantification of DVL2 band intensities (upper to lower band intensity ratio) n = 3. (K) Representative images of NIH3T3 cells following treatment with LGK974 or CytoD, stained for Arl13b (green) and γ-tubulin (red). Scale bar = 2 μm. DAPI (blue) was used to counter stain nuclei. Quantification of the cilia length (L) and the percentage of cells with Arl13+ cilium (M). Each dot indicates either length of a single primary cilium (L) or percentage of ciliated cells in one image frame (M) n = 3.

