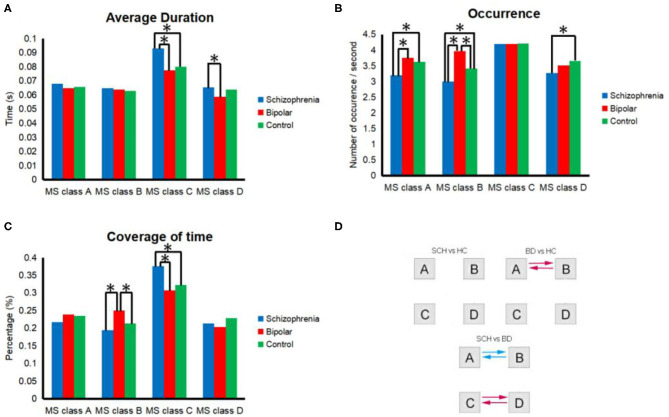
Figure 2.
Properties of microstates in general. All of the 4 microstate classes (MS class) are presented in each segment. (A) occurrence per second; (B) total time coverage; (C) average duration; (D) transition probability. Transition probabilities were analyzed between microstates for HCs and SCH patients, HCs and BD patients, or BD patients and SCH patients. Red and blue indicate significant differences between HCs and BD patients or between BD patients and SCH patients. Specifically, red indicates a higher probability among SCH patients than BD or a higher probability among BD than HCs, and blue indicates a lower probability. *Means significant difference between two groups.

