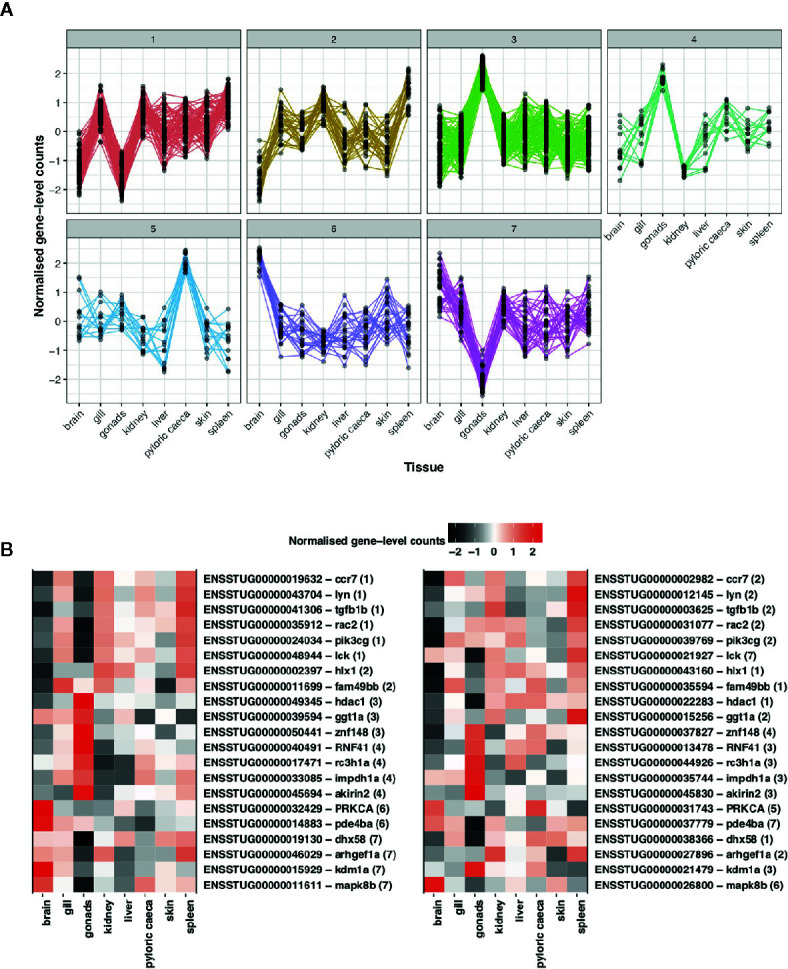
Figure 5.

Assessment of divergence in S. trutta immune ohnolog expression profiles. (A) Clustering based on gene-level counts assigned 302 immune genes, which consist of one member of an ohnolog pair, to seven co-expression networks assigned based on the expression profile of each gene across eight tissue types. Each co-expression cluster is represented by a single line graph whereby the y-axis consists of gene-level counts normalized by Clust and the x-axis consists of eight tissues obtained from a single double haploid female. (B) Heatmap of expression profiles for ohnolog pairs where both ohnologs were assigned to different co-expression networks based on expression profiles across eight tissue types. Ensembl gene ID and description (separated by hyphen) are provided on the y-axis with number in parentheses indicating the cluster the gene was assigned to. The x-axis represents the eight tissues used to construct the co-expression networks.
