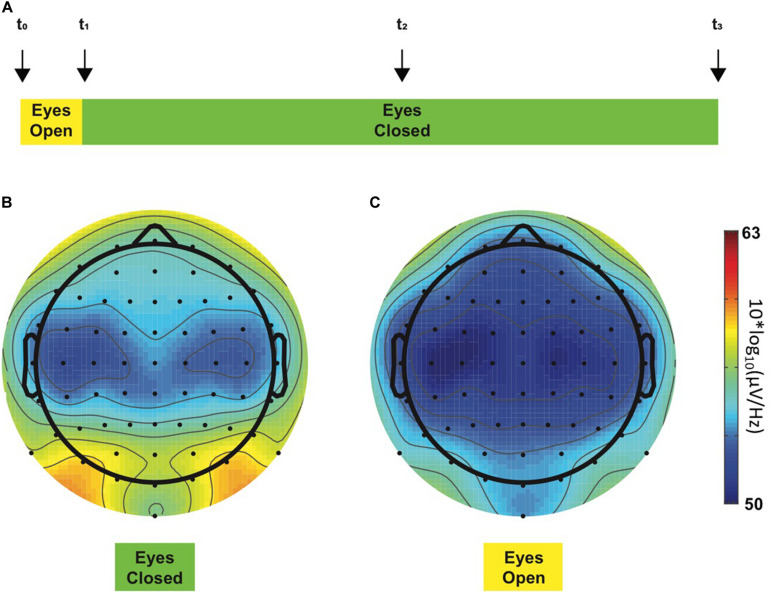
FIGURE 1.
Resting-state EEG recording protocol (A). This 24-min experiment started with a 2-min period, during which the participant opened his eyes (yellow color), and for the rest of the experiment, the eyes had to remain closed (green color). Four acoustic cues (“beeps,” vertical arrows) were presented to the participant during the experimental session to warn him about the ongoing experimental step, i.e., to switch to the eye-closed condition or to keep him awake. Each participant was instructed concerning the meaning of each acoustic cue before the beginning of the experiment. First and last beeps (t_0 and t_3, respectively) determined the beginning and the end of the experimental session, respectively. Second beep (t_1) occurred 2 min after t_0 and instructed the participant to close his eyes, whereas the third beep (t_2) occurred in the middle of the experiment and was implemented to maintain the participants awake as they tend to fall asleep. Alpha GPS-derived topoplots in all chronic neuropathic pain patients during eye-closed (B) and eye-open (C) experimental steps. The color bar at the right side of the figures represents ascending alpha power values from the lowest at the bottom [blue, 50 10*log10(μV/Hz)] through the highest at the top [red, 63 10*log10(μV/Hz)]. As expected, two alpha peaks were observed in posterior regions on the left and the right side, respectively, during the eyes-closed condition (B, left topoplot). On the contrary, these prominent peaks disappeared when the eyes were open (C, right topoplot). GPS significantly differed between eye-closed [−0.02 (4.21) dB] and eye-open [−2.17 (4.15) dB] conditions [t(11) = −4.072, p = 0.002].

