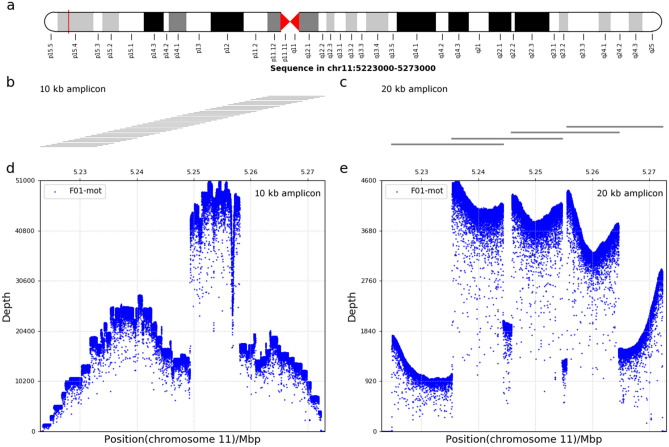
Figure 1.
Targeted region of MinION sequencing. (a) Diagram of the targeted region locus on chromosome 11 containing the HBB gene selected for this study was indicated by the red vertical line. (b and c) Long-range PCR strategy used for haplotyping. PCR amplicons of 10 kb and 20 kb libraries was indicated in (b,c) respectively. 10 kb or 20 kb PCR amplicons were designed overlapped and each horizontal line represents an amplicon. (d,e) The depth distribution and the coverage of sequencing data in the whole targeted region. Examples of the depth distribution of targeted region by MinION sequencing for 10 kb and 20 kb libraries was indicated in (d,e) respectively. The horizontal axis represents the position on chromosome 11. The vertical axis represents sequencing depth.

