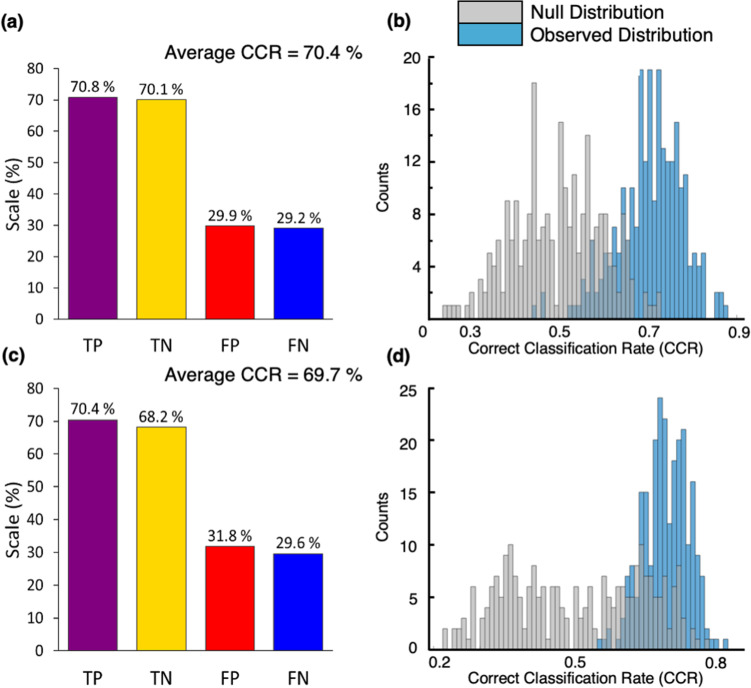
Fig. 1. PLS-DA classification models for (a, b) drug naïve PD vs. control and (c, d) medicated PD vs. control.
a, c Classification rates for each model including true positive (TP, sensitivity), true negative (TN, specificity), false positive (FP), and false negative (FN). b, d Null distribution (grey bars) and observed distribution (blue bars) for each PLS-DA bootstrap model. The correct classification rate (CCR) were calculated from the test sets only (n = 250 from the bootstraps).

