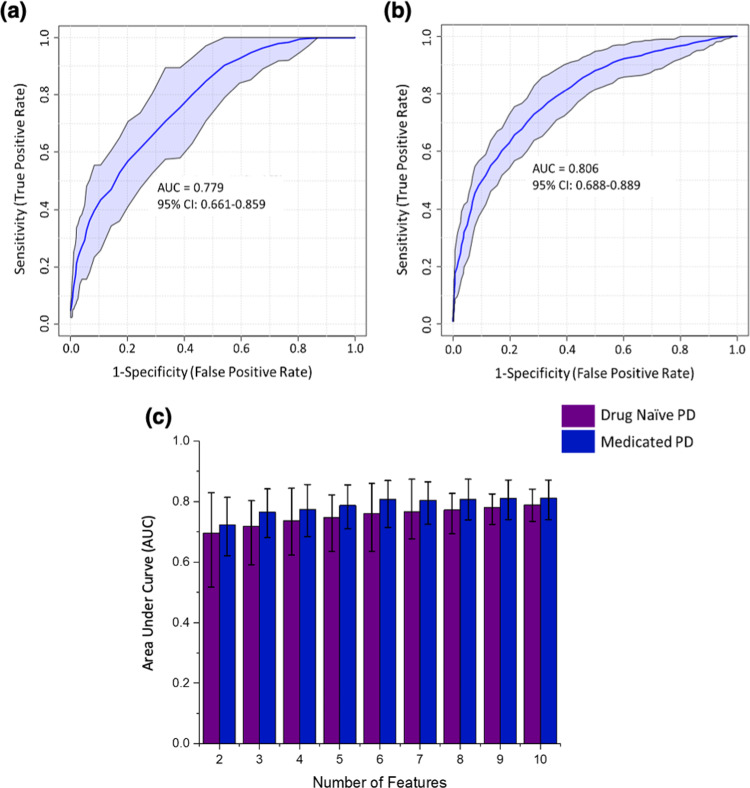
Fig. 2. ROC curve analyses based on a multivariate PLS-DA algorithm with a two latent variable input, AUC and 95% confidence intervals (CI) were calculated by Monte Carlo cross validation (MCCV) using balanced subsampling with multiple repeats.
a ROC curve analysis (n = 15 independent metabolite features) in drug naïve PD vs. control PLS-DA with VIP > 1. b ROC curve analysis (n = 26 independent metabolite features) in medicated PD vs. control PLS-DA with VIP > 1. c A bar chart displaying the comparison of AUCs for drug naïve PD (purple) and medicated PD (blue) using common VIPs between models (n = 10 independent metabolite features), data are presented as mean AUC value with error bars representing the minima and maxima values of the 95% CI range.

