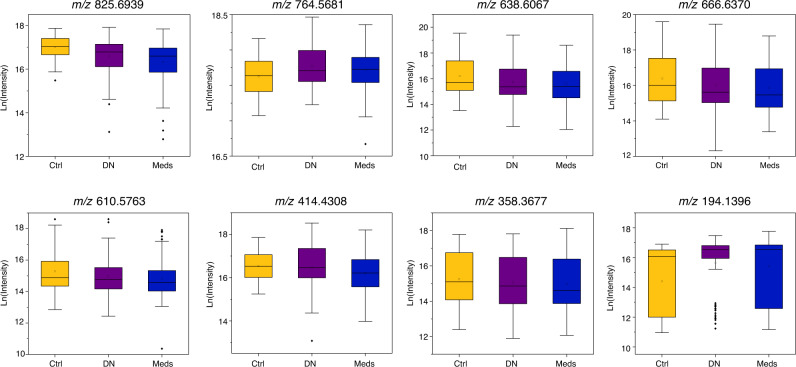
Fig. 3. Box whisker plots for each of the eight putatively annotated compounds for control (Ctrl, yellow) (n = 56 biologically independent samples), drug naïve PD (DN, purple) (n = 80 biologically independent samples) and medicated PD (Meds, blue) cohorts (n = 138 biologically independent samples).
Box plots display mean (square), median (line within box) and quartiles (box limits), range (whiskers) and outliers (diamond). The y-axis of each plot corresponds to the natural log of intensity values and the measured m/z value for each compound is labelled above the plot, these species correlate to the data presented in Table 2A, B.

