Figure 3.
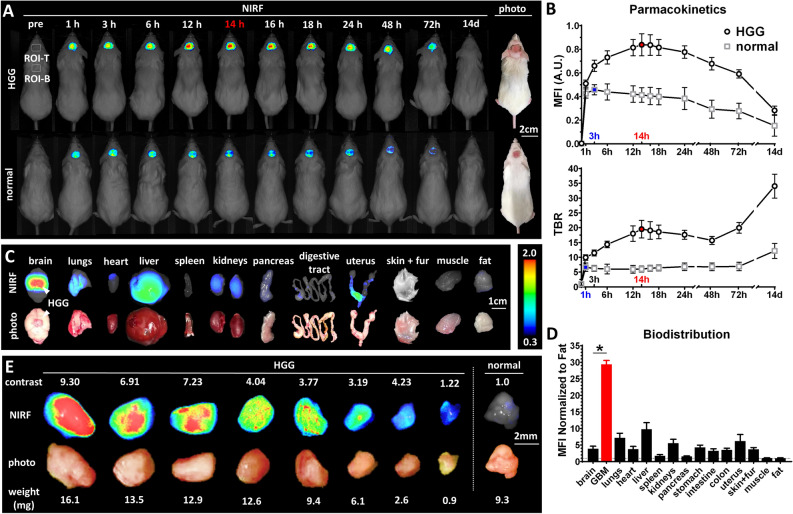
Pharmacokinetics and biodistribution of panitumumab-IRDye800 in vivo and ex vivo. (A) In vivo near-infrared fluorescence imaging (NIRF) of mice bearing orthotopic HGG xenografts or normal mice (sham injection of saline) with cranial windows before and after panitumumab-IRDye800 injection over the period of 14 days. Dotted boxes: regions of interest (ROI) for mean fluorescence intensity (MFI) and target-to-background ratio (TBR) measurements (T: tumor; B: background). (B) Pharmacokinetics of panitumumab-IRDye800 in normal and HGG bearing mice, with standard error of the mean. Red and blue: peak values and corresponding time points for HGG and normal mice, respectively. (C) NIRF images and corresponding photos of organs removed from HGG xenograft-bearing mice at 14 h post panitumumab-IRDye800 injection. Arrows: HGG xenograft. (D) Biodistribution in resected organs was quantified as MFIs (± SEM) normalized to that of fat, *P < 0.001 (n = 5) between normal brain and HGG. (E) NIRF images and corresponding photos of serial bisected HGG tumor pieces and normal brain resected from mouse brains 14 h post panitumumab-IRDye800 injection. TBR: MFI of each HGG tissue piece divided by MFI of normal brain (TBR of normal brain is set to 1.0 for each mouse).

