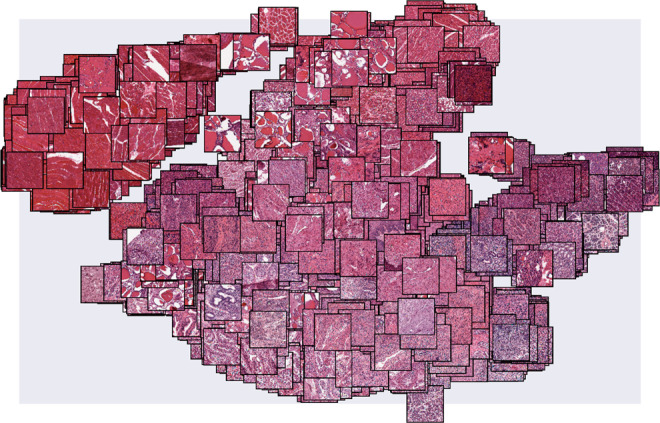
Fig. 1. The embeddings of GTEx histological images.

The image feature representation estimated by ImageCCA for each of the GTEx histological images may be visualized by embedding the images based on their feature values into two dimensions using t-SNE56. We plot each histological image in this two-dimensional space. Images with similar morphological features are closer together, with skeletal muscle tissues forming a noticeably distinct cluster from the remaining tissue types in the upper left corner.
