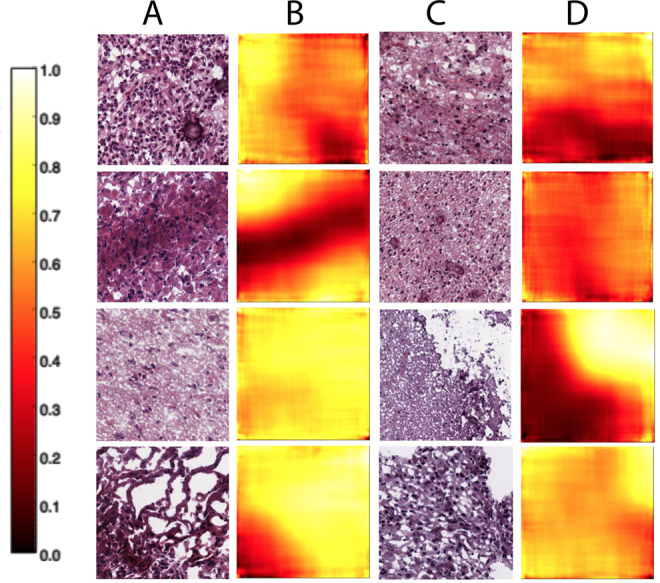
Fig. 3. Classifying primary versus recurrent tumor locations in LGG histopathological images.

For each overlapping 128 × 128 patch in a 1000 × 1000 pixel image, we classify the likelihood that the patch contains recurrent tumor cells. We used these predictions to create a heatmap of primary tumor (values closer to zero) versus recurrent tumor (values closer to one) locations in the image. Columns A and C are LGG histopathological images; columns B and D are the corresponding heatmaps showing the locations in the images classified as higher likelihood of primary tumor (darker colors) versus higher likelihood of recurrent tumor (lighter colors).
