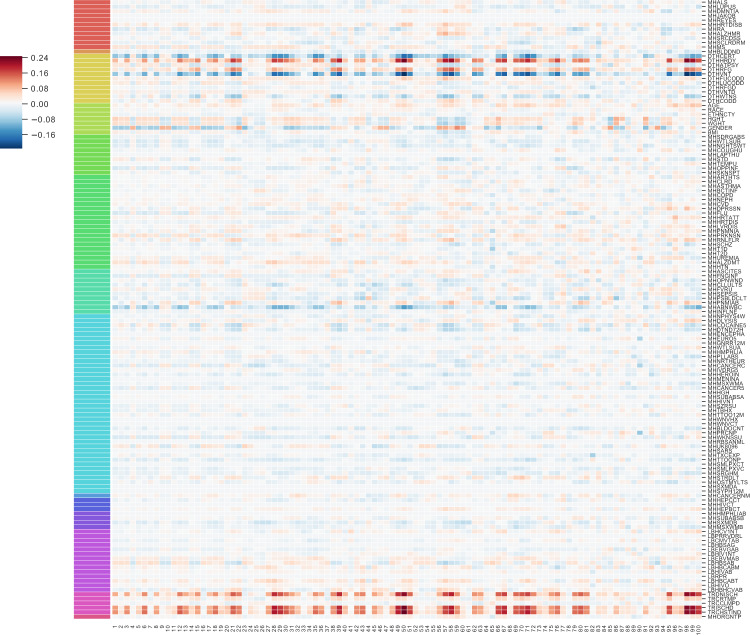
Fig. 4. Pearson’s correlation of 100 components of GTEx CCA with GTEx covariates.
The 100 GTEx CCA components are ordered on the x-axis; 138 available GTEx covariates are on the y-axis. The legend on the left refers to the Pearson’s correlation between each component and the GTEx covariates. Some of the CCA components were sign-flipped so that the Pearson’s correlation with covariate Chest Incision Time was non-negative without loss of generality. The colors correspond to covariates in one of the following categories: Autoimmune, Degenerative, Neurological (red), Blood Donation (orange), Death Circumstances (yellow), Demography (yellow green), Evidence of HIV (light green), General Medical History (green), History at Time of Death (sea green), Information (light blue), Medical History (blue), Potential Exposure: Physical Contact (royal blue), Potential Exposure: Sexual Activity (purple), Serology Results (fuchsia), Tissue Recovery (pink), and Tissue Transplant (pink red).

