Figure 7.
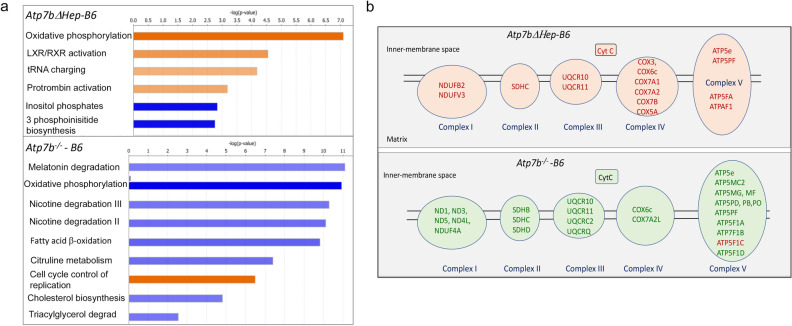
Comparison of the altered pathways in Atp7bΔHep-B6 and Atp7b-/–B6 livers using Ingenuity Pathway Analysis (IPA). (a) The most significantly changed pathways (|Z| score > 2.5 for Atp7b-/–B6 animals and > 2.3 for Atp7bΔHep-B6 pathways. The data were generated using samples analyzed within the same mass-spectrometry run; n = 3 per each genotype. Orange color indicates the upregulated pathways and blue color – down-regulated pathways. The complete list of affected pathways is given in Suppl Table 4 and Suppl Table 5. (b) Components of the respiratory chain in mitochondria that are significantly changed in response to Cu accumulation in Atp7bΔHep-B6 and Atp7b-/–B6 mice. Upregulated proteins are labeled in red, down-regulated proteins are in green. Data generated and visualized using IPA (https://digitalinsights.qiagen.com/products-overview/discovery-insights-portfolio/analysis-and-visualization/qiagen-ipa/).

