Figure 4.
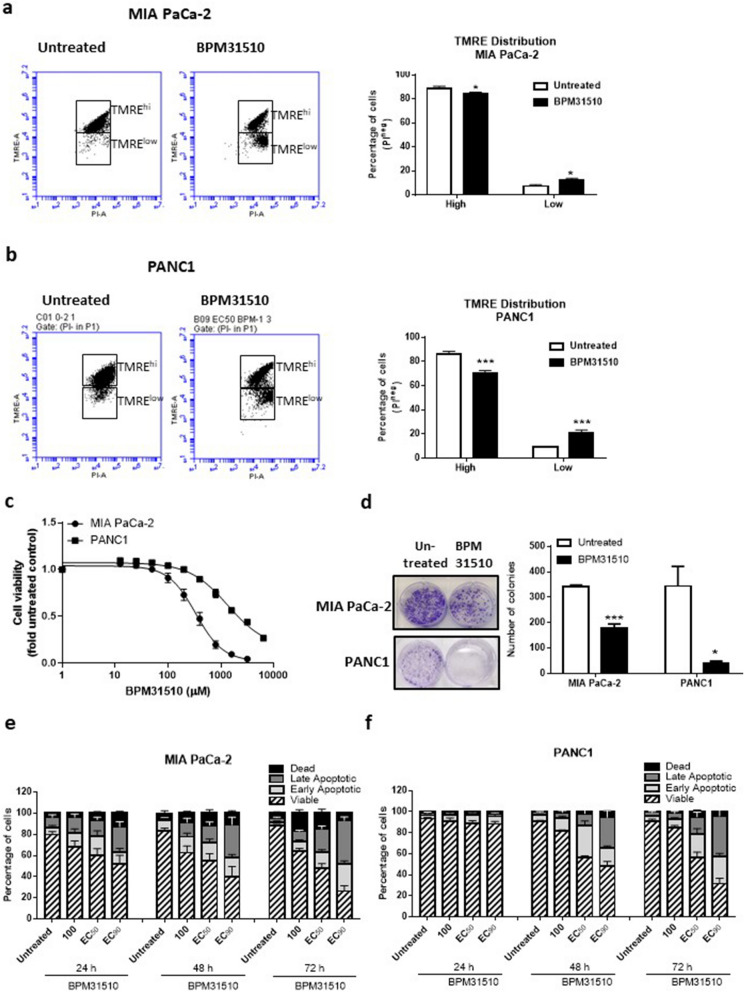
BPM31510 treatment hyperpolarizes the mitochondrial membrane potential prior to promoting regulated cell death in MIA PaCa-2 and PANC1 cells. (a) Representative scatter plots of untreated and BPM31510-treated MIA PaCa-2 cells illustrating the gating strategy used to measure the percentage and mean fluorescent intensity of tetramethylrhodamine, ethyl ester (TMRE) high and low cells (Right panel). Percentage of TMRE high-expressing and low-expressing MIA PaCa-2 cells 48 h after BPM31510 exposure. The data represent the means + SEM of three independent experiments. (b) Representative scatter plots of untreated and BPM31510-treated PANC1 (Right panel). Percentage of TMRE high-expressing and low-expressing PANC1 cells 48 h after BPM31510 exposure. The data represent the means + SEM of three independent experiments. (Left panel) (c) Dose–response of BPM31510 on cell viability in MIA PaCa-2 and PANC1 cancer cells. The data represent the means ± SEM of three independent experiments. (d) Colony formation after BPM31510 exposure (EC50) for 72 h. Representative images of colonies and corresponding quantitation are shown. The data represent the means + SEM of three independent experiments. (e,f) Dose- and time-assessment of BPM31510 on Annexin V and propidium iodide (PI) staining in MIA PaCa-2 (e) and PANC1 cells (f). The data represent the means + SEM of three independent experiments. The data report the percentage of the population that is viable (Annexin V negative and PI negative), early apoptotic (Annexin V positive and PI negative), late apoptotic (Annexin V positive and PI positive), and dead/necrotic cells (Annexin V negative and PI positive). All data were analysed by Student’s t test; *p < 0.05 and ***p < 0.001 compared to the untreated group.

