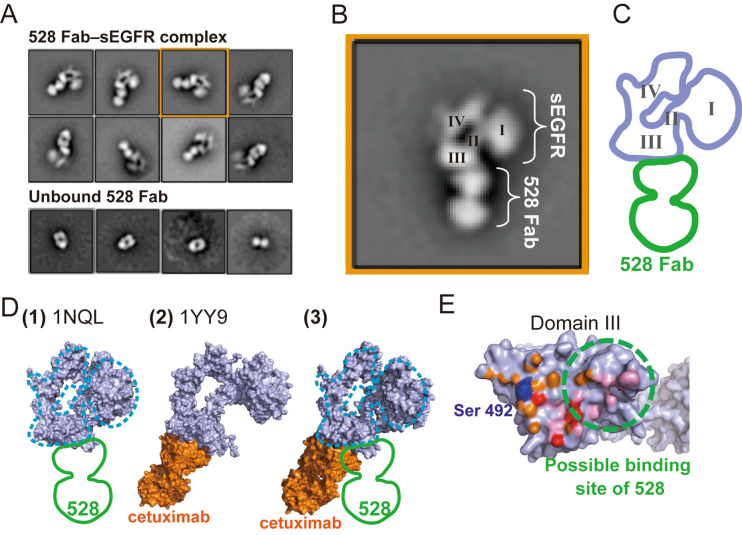
Figure 2.
Negative-staining electron microscopy of the 528 Fab–sEGFR complex. (A) Two-dimensional (2D) class averages of the negatively stained 528 Fab–sEGFR complex. The purified complex was subjected to single particle image analysis via negative-staining electron microscopy. Upper panel: representative 2D class averages of the 528 Fab–sEGFR complex in their different orientation classes. Lower panel: dissociated 528 Fab. (B) Magnified representation of a 2D class average shown in (A) (orange square in (A), 90° rotated). Four domains of sEGFR are labeled. (C) An outline trace of the averaged image of (B) the sEGFR portion is shown in light purple and the 528 Fab portion is shown in green. (D) (1) A crystal structure of sEGFR (light purple, PDBID: 1NQL) overlapping with the outline trace (blue dashed line: sEGFR, green: 528 Fab). (2) A crystal structure of the cetuximab Fab–sEGFR complex (sEGFR: light purple, Cetuximab: orange, PDBID: 1YY9). (3) Cetuximab Fab onto the 1NQL sEGFR structure by superposing the domain III of both structures. The outline trace is overlapped onto the sEGFR structure (blue dashed line: sEGFR, green: 528 Fab). (E) Domain III surface from the view of the cetuximab side. Atoms within 3.5 Å from cetuximab and EGF are colored with orange (cetuximab), pink (EGF), and red (both). A possible binding area of 528 is indicated with a dashed green circle. Ser 492 is shown in blue.

