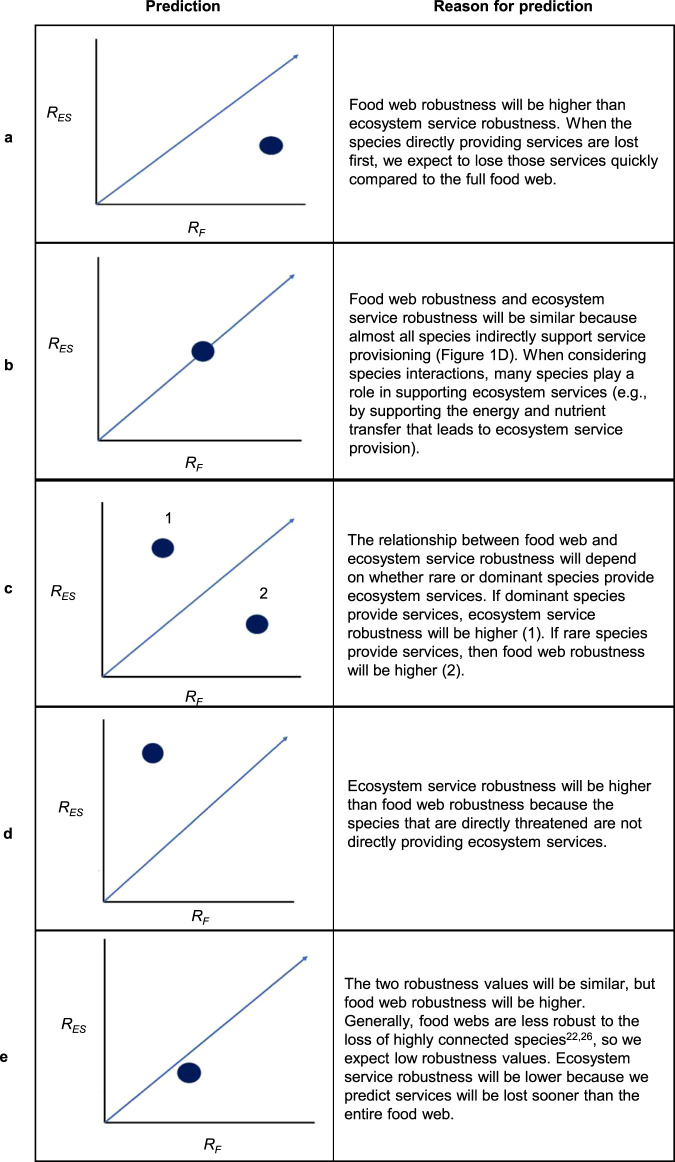
Fig. 2. Predictions for the relationship between food web robustness (RF; the tolerance of a food web to species loss) and ecosystem service robustness (RES, the tolerance of ecosystem service nodes in a network to species loss).
In each figure ((a–f), middle column), the x axis is food web robustness, the y-axis is ecosystem service robustness, and the blue line represents a 1:1 relationship between the two (x = y). The dots show the relationship we expect between the two robustness values under each sequence of species loss, shown in different rows: a–e. Thus, if the robustness of the ecosystem services is highly correlated with the robustness of the food webs, the blue dot would fall on the line.

