
Fig. 4. Illustrating robustness calculations.
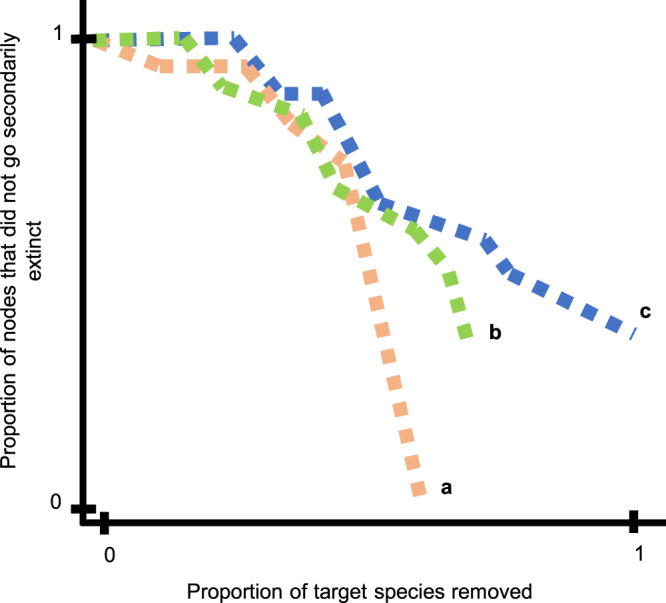
As species are removed (i.e., primary extinctions) secondary extinctions occur when species no longer have resources (in-degree = 0). Primary extinctions are tracked on the x axis and secondary extinctions on the y axis as proportions and robustness is the area under the curve. If all target species are removed, the x axis will reach x = 1 (e.g., line c). If a subset of the target species is secondarily lost (e.g., lines a and b), the line will not reach x = 1. If the line reaches y = 0, all secondary losses are realized (e.g., line a). If the line does not reach x = 1 or y = 0, that implies that (1) some target species went secondarily extinct, and/or (2) there are still species remaining in the food web (e.g., line b).