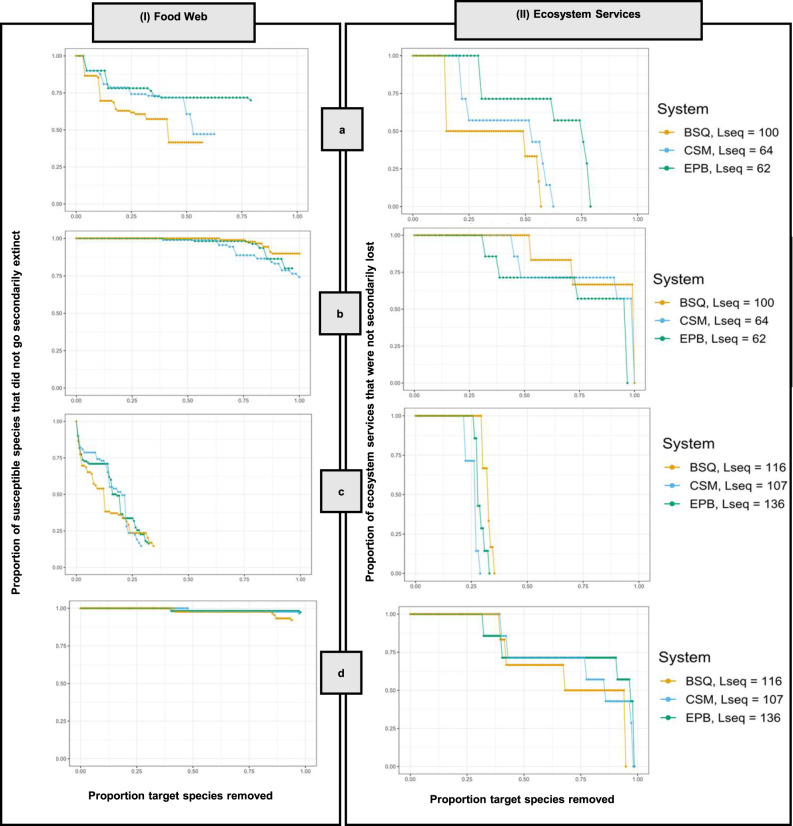
Fig. 5. Food web (I) and ecosystem service (II) responses to primary species removal result in different rates of secondary losses.
Each box shows the sequential loss of species and/or ecosystem services for 4 of the 12 species loss sequences (see Supplementary Fig. 7 for the remaining sequences): a Ecosystem service providers, high to low biomass, b ecosystem service providers, low to high biomass, c Supporting species, most to least important, and d Supporting species, least to most important. The three colors show the three salt marsh systems: Bahia Falsa de San Quintin (BSQ, gold), Carpinteria Salt Marsh (CSM, blue), and Estero de Punta Banda (EPB, green). Lseq indicates the length of each sequence (the denominator in the x axis). Note that not all sequences are the same length.

