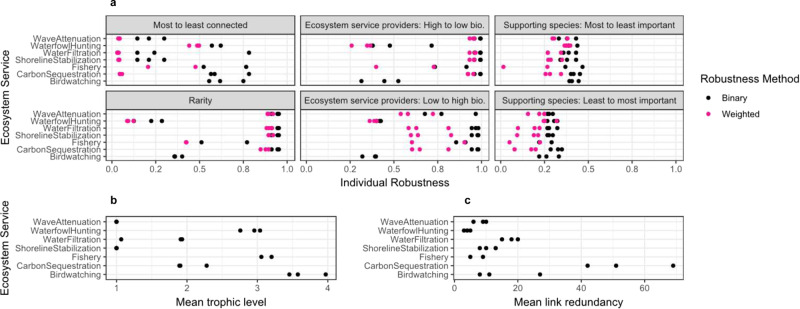
Fig. 6. Individual ecosystem service robustness varies by trophic level and link redundancy.
a Individual ecosystem service robustness across the three salt marsh systems and sequences: most to least connected, ecosystem service providers: high-to-low biomass, supporting species: most-to-least important, rarity, ecosystem service providers: low-to-high biomass, supporting species: least-to-most important. Individual ecosystem services respond differently to species across sequences. Pink data points represent individual ecosystem robustness values when calculated based on presence–absence of a species and black data points represent individual ecosystem service robustness values when calculated based on biomass. Birdwatching was excluded from the weighted method extension because the relationship between species and service is not proportional to biomass. b Trophic level of each ecosystem service across systems. c Link redundancy of each ecosystem service across systems.

