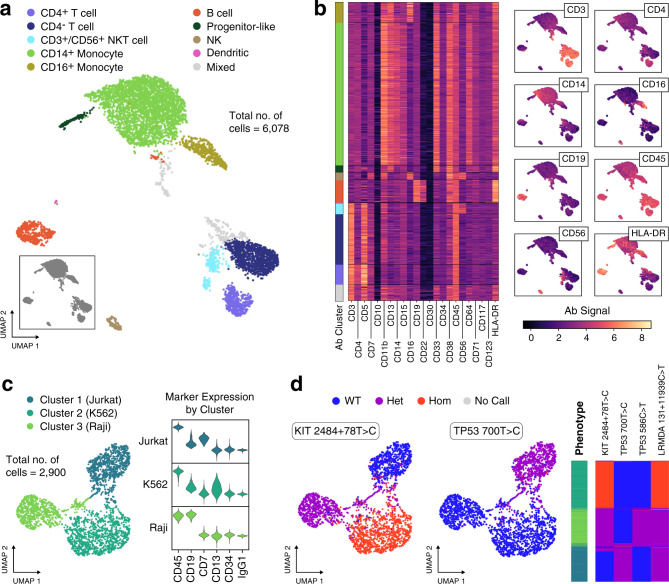
Fig. 2. DAb-seq enables simultaneous discrimination of single cells by their immunophenotype and genotype.
a DAb-seq workflow performed on PBMCs from a healthy donor using a panel of 23 antibodies. Leiden clustering and two-dimensional UMAP embedding of the antibody tag data reveals expected blood cell populations. Cell clusters are manually annotated based on detected marker expression. b Heatmap of the corrected log-transformed antibody counts for each cell and antibody. Cells are ordered based on Leiden clusters. Overlay of corrected log-transformed antibody counts with the UMAP embedding highlights compartment-specific expression. c Correspondence of antibody signal with genomic polymorphisms in DAb-seq experiments tested on a mixture of three cell lines and a panel of six antibodies. Cells cluster by antibody signal as shown in the UMAP embedding. d Detected single-nucleotide polymorphisms in these cells map to the phenotypic cell clusters as shown in the UMAP embedding and a heatmap, where rows correspond to single cells. The first column of the heatmap indicates assigned phenotype cluster, and the remaining columns indicate the genotyping call at the labeled loci. Source data are provided as a Source data file.

