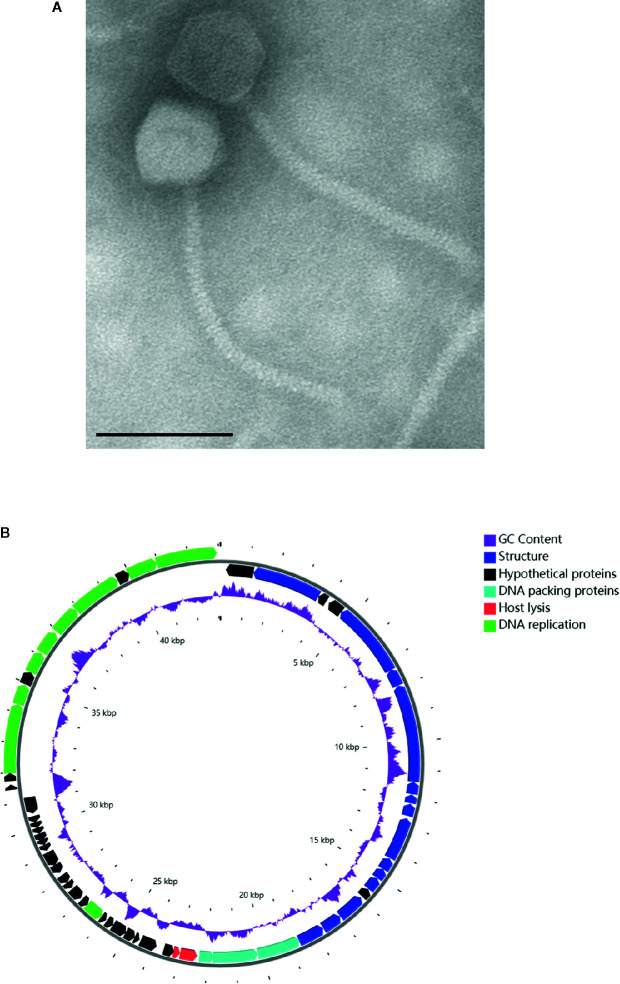
Figure 2.
Characterization of phage Ab_SZ3. (A) Transmission electron micrographs of the phage. Scale bar represents 100 nm. (B) Genome map of the phage. The color of the ORFs refers to five modules: phage structure, blue; host lysis, red; DNA packaging, light blue; DNA replication, green; and hypothetical proteins, black. GC content, purple.

