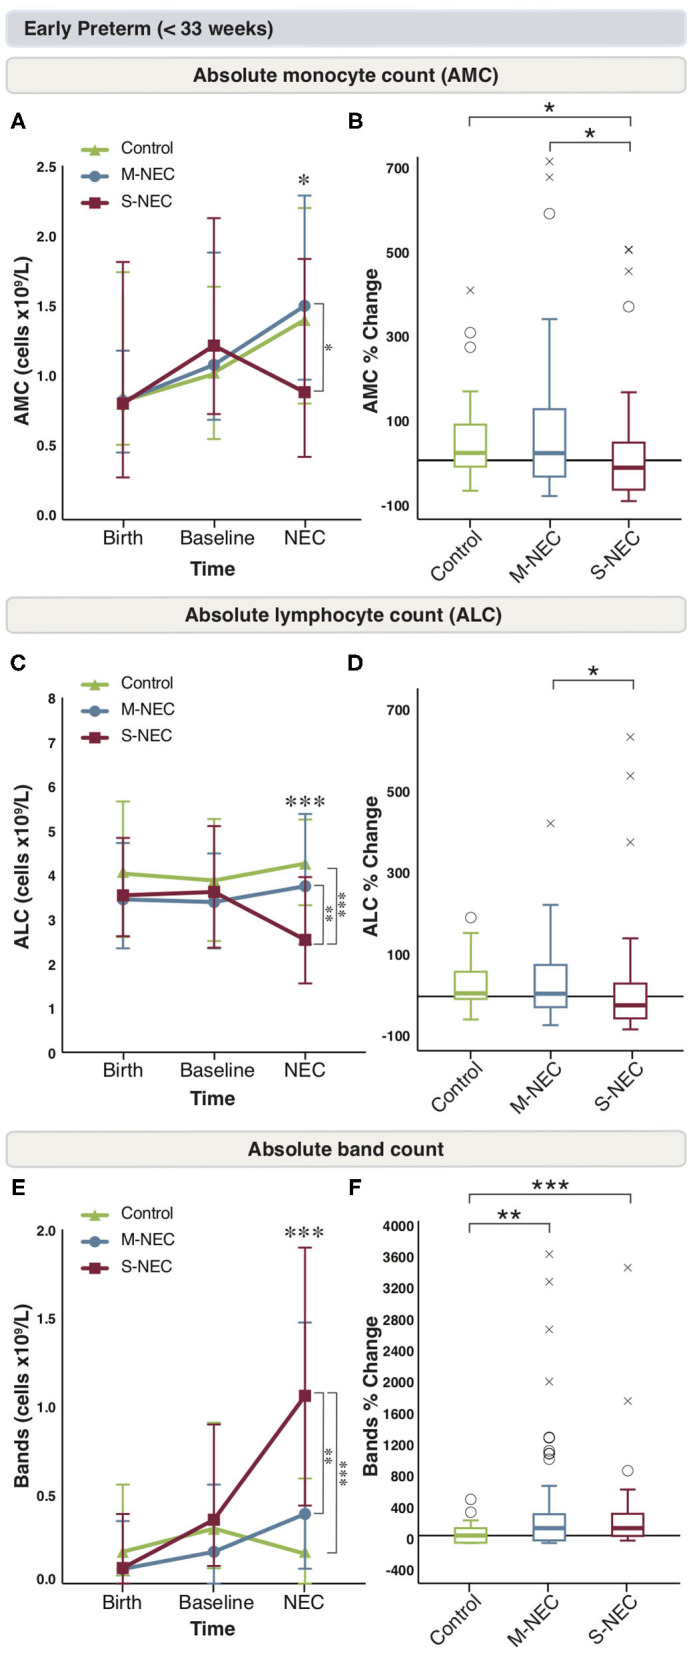
Figure 2.

Changes in peripheral cell counts for infants <33 weeks. Median absolute levels of monocytes (A), lymphocytes (C), and bands (E) are plotted at birth, baseline, and NEC diagnosis. Tukey boxplots for percent changes in monocytes (B), lymphocytes (D), and bands (F) at NEC diagnosis compared with baseline. Bars represent 25 and 75% percentiles (A,C,E) or 1.5×the interquartile ranges (IQR) (B,D,F). *Significance for absolute cell count; *p < 0.05, **p < 0.01, ***p < 0.001. *Significance for percent change; *p < 0.05, **p < 0.01, ***p < 0.001. °Indicates outliers (>1.5 × IQR) and xindicates extreme outliers (>3 × IQR).
