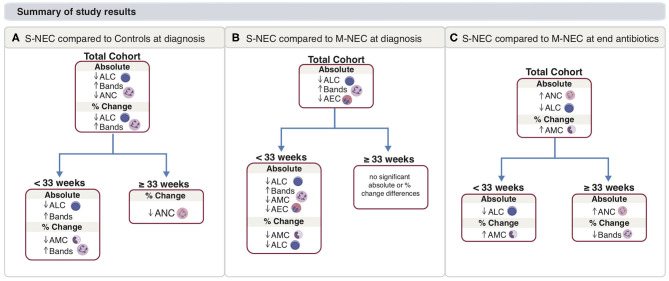
Figure 7.
Main study results. Summary for S-NEC compared with controls (A) and M-NEC (B) for absolute and percent change differences at NEC diagnosis from baseline. (C) Summary for S-NEC compared with M-NEC for absolute and percent change differences at the end of antibiotics compared with NEC diagnosis.

