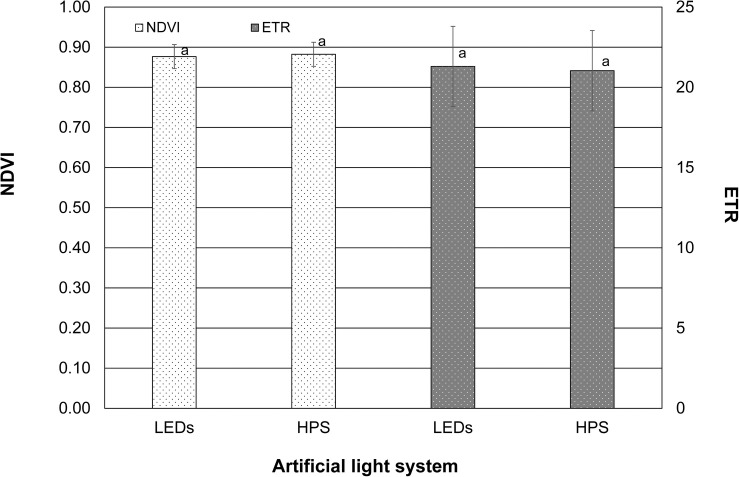
FIGURE 3.
Normalized difference vegetation index (NDVI) and electron transport rate (ETR) of tomato leaves exposed to LEDs and HPS lighting. Data represent mean values of three repetitions in three consecutive weeks (n = 3). NDVI and ETR were tested using student’s t-tests. Different small letters illustrate significant differences (p < 0.05).

