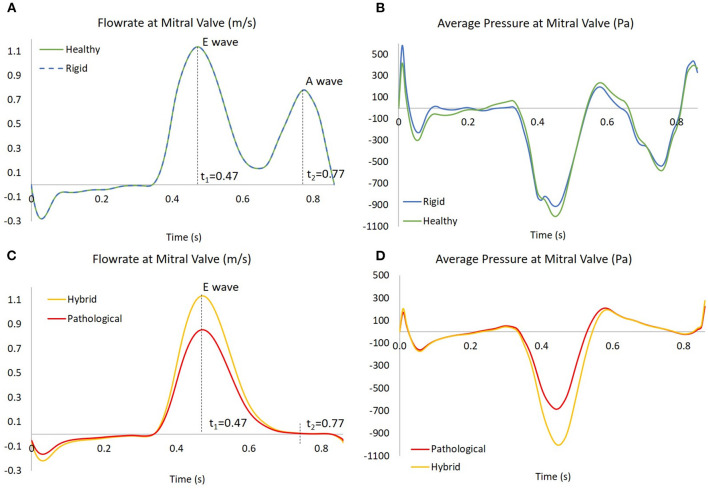
Figure 4.
In (A,C), the flowrates at mitral valve for the four scenarios; the instants t1 = 0.47 s and t2 = 0.77 s are showed, corresponding to E wave and A wave, respectively. In (B,D), the pressures at mitral valve for the four scenarios, obtained as results of four simulations based on the flowrate in the left panel.

