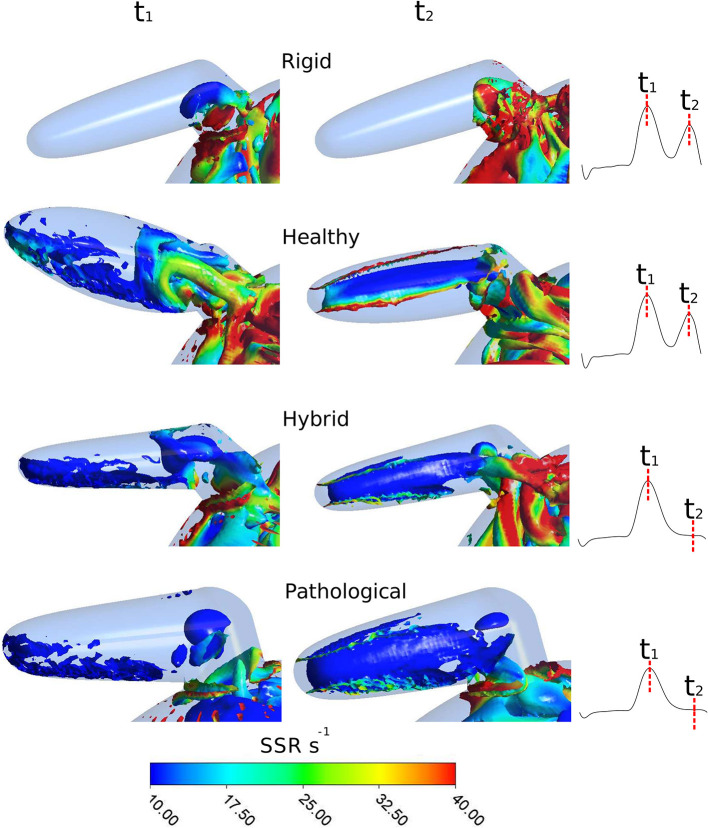
Figure 8.
Instantaneous vortex structures within LAA colored according to the SSR parameter, at E wave peak (corresponding to t1) and at A wave peak (corresponding to t2) of the fourth cardiac cycle. To visually appreciate the extent of the regions prone to thrombus formation, the SSR scale starts from 10 s−1. First row: Rigid; second row: Healthy; third row: Hybrid; fourth row: Pathological.

