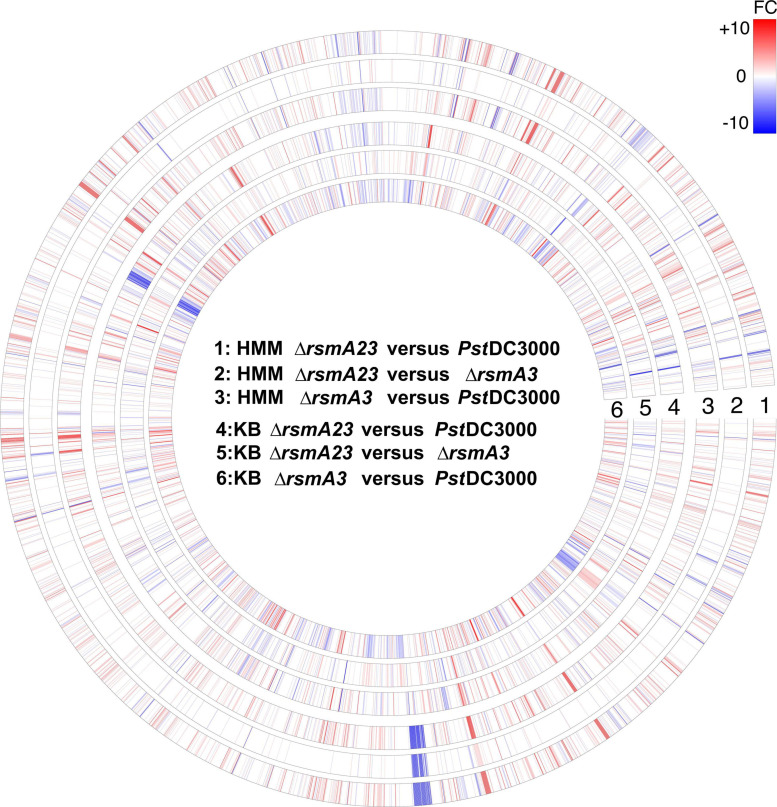
FIGURE 1.
Circular map of RNA-seq data for all 5348 genes. For each gene, red or blue color represents fold change (FC) ≥ 1.5 and FC ≤ –1.5 with a p value < 0.05, respectively. The higher the | FC|, the deeper the color. Rings # 1, 2, and 3 represent FCs for comparison of ΔrsmA23 versus PstDC3000, ΔrsmA23 versus ΔrsmA3, and ΔrsmA3 versus PstDC3000 in HMM, respectively. Rings # 4, 5, and 6 represent FCs for comparison of ΔrsmA23 versus PstDC3000, ΔrsmA23 versus rsmA3, and ΔrsmA3 versus PstDC3000 in KB, respectively. HMM: hrp-inducing minimum medium; KB: King’s B medium; PstDC3000: Pseudomonas syringae pv. tomato DC3000; ΔrsmA3: the rsmA3 mutant; ΔrsmA23: the rsmA2/A3 double mutant.

