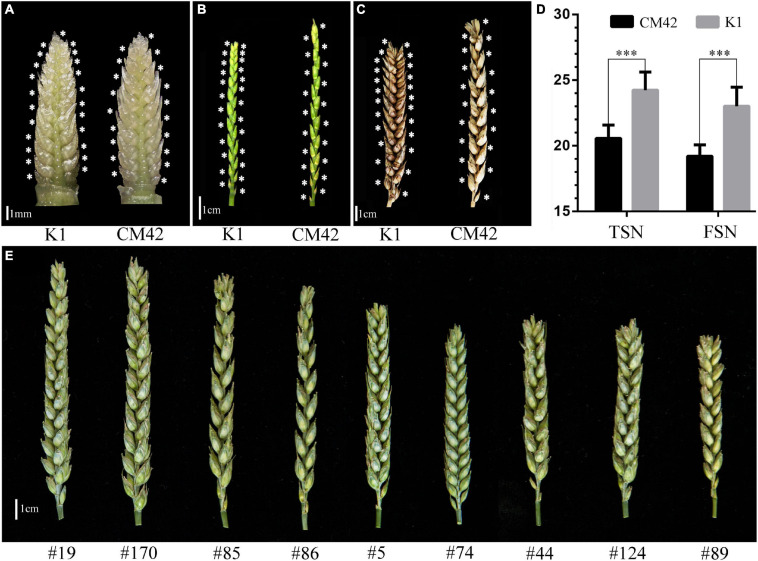
FIGURE 1.
Spike morphology of the parents and representative lines. The morphology of spikes of K1 and CM42 at young spike stage when terminal spikelet appeared (A), heading stage (awn was cut) (B), and maturity (awn was cut) (C) are shown. (D) The mean of total spikelet number per spike (TSN) and fertile spikelet number per spike (FSN) of K1 and CM42 at maturity in five environments. (E) The morphology of spikes of representative lines from the K1/CM42 population; ∗∗∗ represents significance at P < 0.001.

