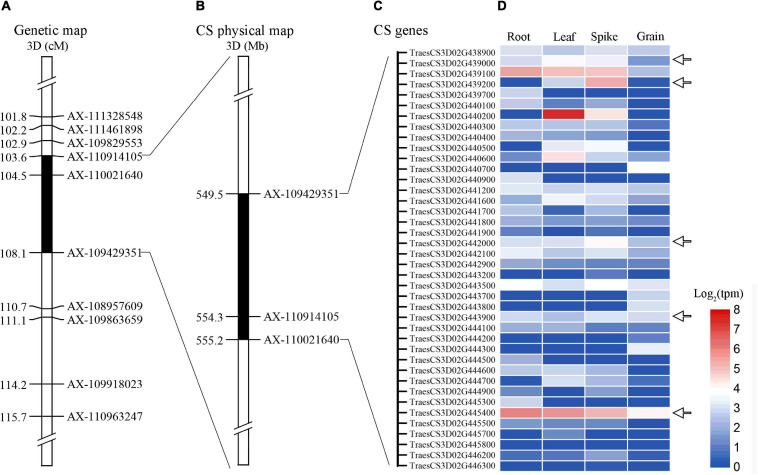
FIGURE 6.
Expression patterns of genes in the physical interval of QTsn/Fsn.cib-3D in various tissues. Black areas are the genetic interval (A) and physical interval of QTsn/Fsn.cib-3D on chromosome 3D (B); (C) and (D) represent the genes that were expressed in various tissues and their expression patterns.

