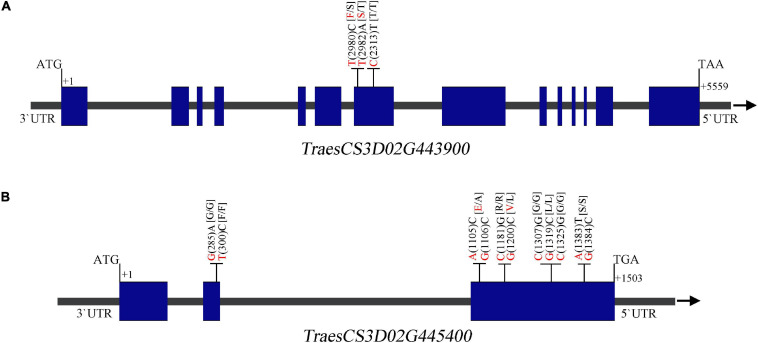
FIGURE 7.
Sequence analysis of the TraesCS3D02G443900 (A) and TraesCS3D02G445400 (B) showing the single-nucleotide polymorphisms (SNPs) and corresponding amino acid variations between K1 and CM42, and K4 and YFM2. The nucleotide of K1 and the other parents is shown in red and black, respectively. Blue box and gray line on gene structure schematic diagrams represent the exome and intron or UTR, respectively.

