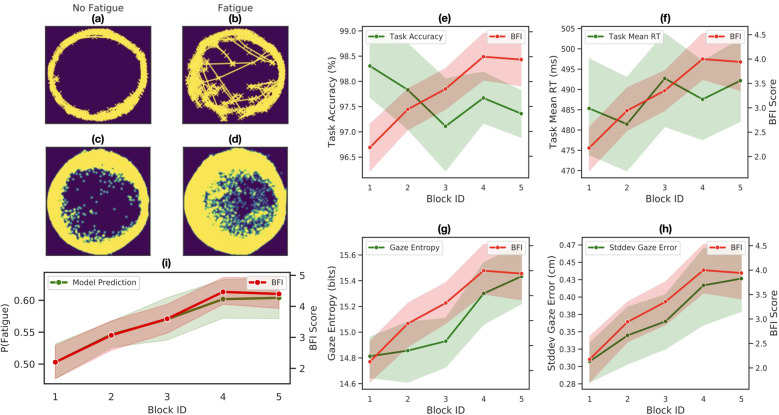
Fig. 2. Progression of fatigue, gaze, and task performance features over time.
a, b Sample gaze patterns from a single participant for the "No Fatigue'' vs. "Fatigue'' condition. c, d Corresponding population-level gaze heatmaps. e–h. Progression of task and gaze features over time. Error bands denote the Mean ± SEM (n = 17 participants). i Model prediction of the probability of fatigue over time, along with the self-reported BFI score.

