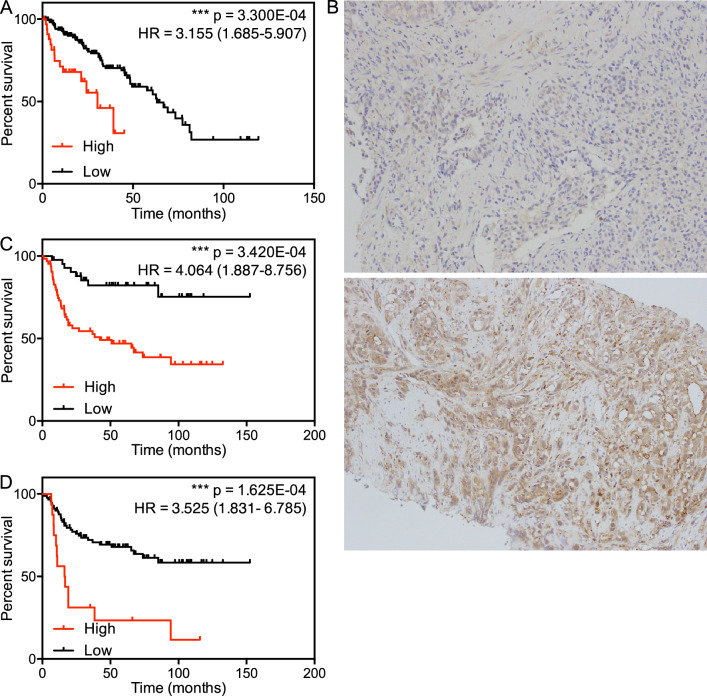
Figure 1.
Effect of GRB2 expression on survival. (A) Recurrence-free survival curves for prostate cancer patients in the TCGA dataset. Each population was divided into two groups according to the cutoff point defined by Cox regression model (cutoff z-score = 1.0951). (B) Representative images of prostate cancer biopsy samples showing low (top) or high (bottom) expression of GRB2 protein. C and D. Recurrence-free survival curves for prostate cancer patients in the local clinical cohort. Each population was divided into two groups according to the cutoff point defined by the Cox regression model (cutoff H-score = 69.8592) (C) and a z-score = 1 (D).

