Figure 1.
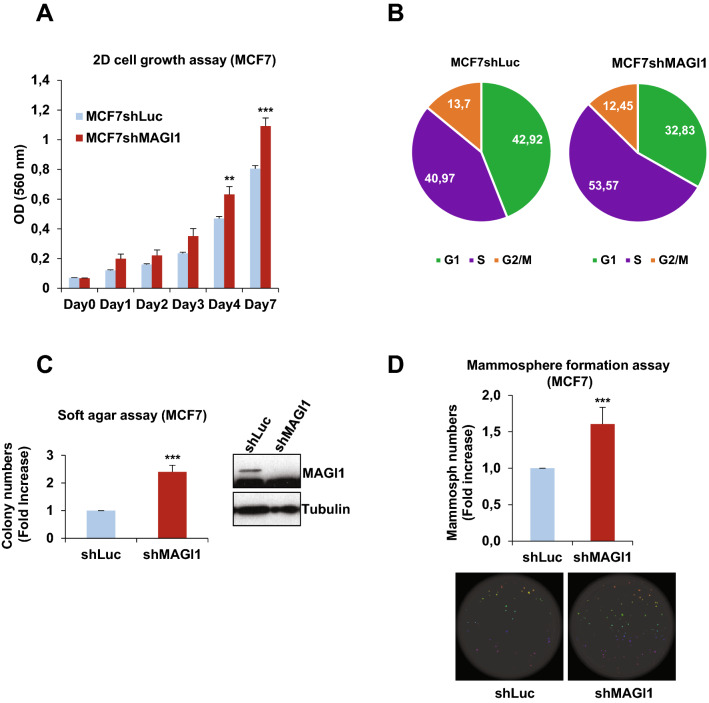
MAGI1 impairment induces tumorigenic phenotypes in epithelial cells. (A) MTT assay (OD 560 nm) representing 2D cell growth of MCF7shMAGI1 as compared to MCF7shLuc cells. Bars represent mean ± Standard Deviation (SD; n = 10 wells as replicates) of a representative experiment (out of 3). Unpaired two-tailed Student's t-test; **p < 0.01; ***p < 0.001. (B) Cell cycle phases of MCF7shLuc and MCF7shMAGI1 cells assessed after BrdU incorporation and analyzed by flow cytometry, showing an increased proportion of cells in S phase at the expense of G0/G1 after MAGI1 invalidation. The pie chart also showed no major difference in the percentage of apoptotic cells in SubG1 phase (around 2% in shLuc and 1% in shMAGI1 cells). (C) Left: quantification of colony numbers of MCF7shMAGI1 cells grown in anchorage independent conditions (soft agar assay) and represented as fold increase compared to MCF7shLuc cells. Data are presented as the means ± SD (n = 3). Unpaired two-tailed Student's t-test; ***p < 0.001. Right: western blot analysis of whole protein extracts issued from the cells used in the soft agar assays and showing the relative amounts of MAGI1 in the different cell lines; Tubulin was used as a loading control. Uncropped blots can be found in the Supplementary Information. (D) Top: quantification of mammospheres represented as total area issued from MCF7shMAGI1 cells and shown as fold increase compared to MCF7shLuc cells, starting from 200 cells. Data are presented as the means ± SD (n = 4). Unpaired two-tailed Student's t-test; ***p < 0.001. Bottom: images of mammosphere formation assay showing a representative experiment.

