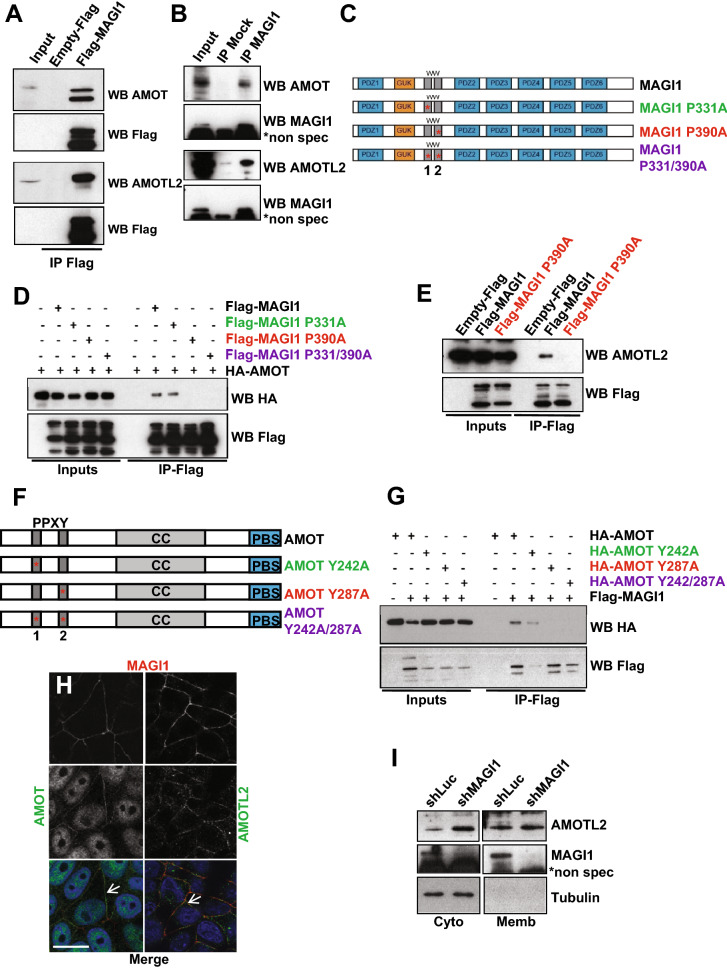
Figure 7.
MAGI1 interacts with AMOT and AMOTL2. (A) Western blot of Flag-MAGI1 immunoprecipitates: Flag-MAGI1 transfections were performed in MCF7 cells and endogenous AMOT (upper panels) and AMOTL2 (lower panels) were revealed; Flag blotting was used as the immunoprecipitation control. Note that we could hardly detect Flag-MAGI1 by Western blot in the inputs, even though MAGI1 was well immunoprecipitated, due to sensitivity issues associated with single Flag tag in Flag-MAGI1 used in this typical experiment. Uncropped blots can be found in the Supplementary Information. (B) Western blot analysis of endogenous MAGI1 immunoprecipitates revealing the presence of endogenous AMOT (upper panels) and AMOTL2 (lower panels). MAGI1 blotting was used as the immunoprecipitation control (*shows non-specific bands with the anti-MAGI1 antibody). Uncropped blots can be found in the Supplementary Information. (C) Schematic of full length MAGI1 and of the point MAGI1 WW domain mutants used (P331A and P390A). (D) Western blot analysis of Flag-MAGI1 immunoprecipitates on protein extracts from MCF7 cells transfected with HA-AMOT and different Flag tagged MAGI1 constructs, showing that the interaction with AMOT occurred through the second WW domain of MAGI1 (interaction lost in P390A; red). Uncropped blots can be found in the Supplementary Information. (E) Western blot analysis of Flag-MAGI1 immunoprecipitates on protein extracts from MCF7 cells transfected with Flag-MAGI1 or Flag-MAGI1 P390A mutant, revealing the interaction of endogenous AMOTL2 with Flag-MAGI1 but not Flag-MAGI1 P390A (red). Uncropped blots can be found in the Supplementary Information. (F) Schematic of full-length AMOT and of the point AMOT PPXY mutants used (Y242A and Y287A). (G) Western-blot analysis of Flag-MAGI1 immunoprecipitates on protein extracts from MCF7 cells transfected with Flag-MAGI1 and different HA-AMOT constructs, showing that the interaction occurs through the second PPXY domain of AMOT (interaction lost in Y287A; red). Similar levels of interaction were obtained for HA-AMOT/Flag-MAGI1 and HA-AMOT Y242A/Flag-MAGI1 complexes (quantified using the ImageJ software). Uncropped blots can be found in the Supplementary Information. (H) Representative immunofluorescence images of endogenous staining for MAGI1 (red; top panels) co-localizing at the plasma membrane (white arrows) with AMOT (green; left) or AMOTL2 (green; right) in MCF7 cells. Note the non-specific nuclear staining for AMOT. Scale bar = 10 µm. (I) Western blot analysis after subcellular fractionation showing the relative amount of AMOTL2 protein in the cytoplasmic and membrane fractions in MCF7shMAGI1 compared to MCF7shLuc cells. Tubulin was used as a cytoplasmic control for the fractionation and for normalization. Uncropped blots can be found in the Supplementary Information.

