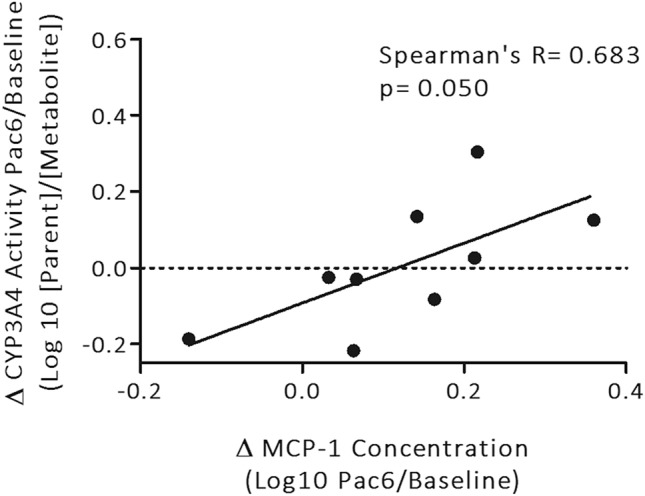
Figure 3.

Correlation between changes in serum MCP-1 and changes in CYP3A4 metabolising activity during chemotherapy. The change in MCP-1 cytokine concentrations from before to after chemotherapy (log10), was correlated with the change in CYP3A4 metabolising activity from before to after chemotherapy (log10; n = 9). Black solid lines represent linear regression line of best fit. Horizontal black dotted lines represent no change in CYP3A4 metabolising activity from baseline to paclitaxel dose six, and points above or below this represent a decrease or increase in CYP3A4 metabolising activity, respectively. Statistical analysis was performed using Spearman correlation analysis, and significance was determined as p ≤ 0.05.
