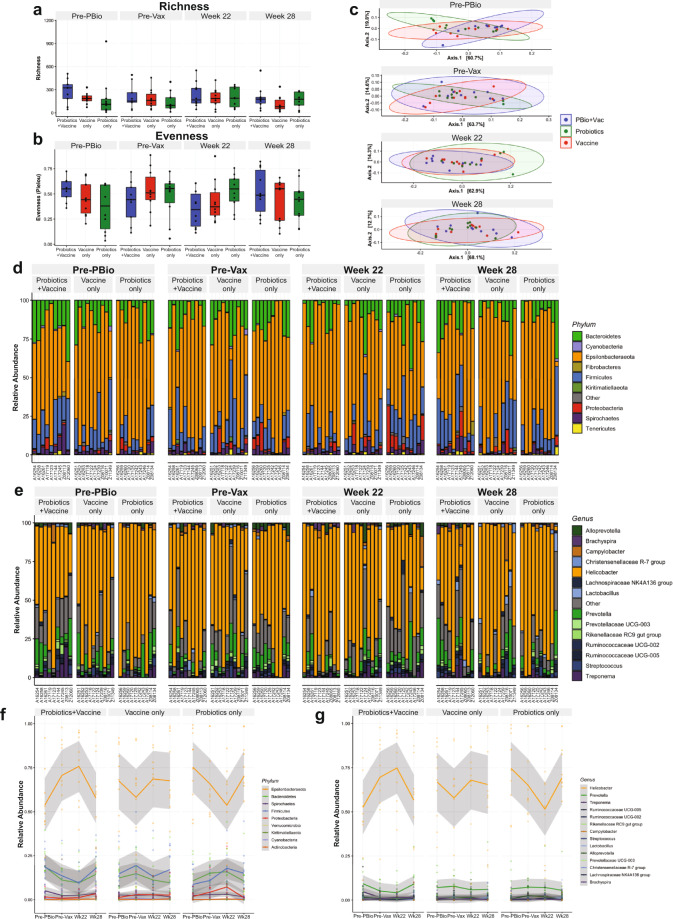
Fig. 2. Microbial communities are minimally disrupted in colonic tissue during probiotic administration, SIV/HIV vaccination, or combination Probiotics+Vaccine.
16s rRNA gene sequencing was used to characterize microbial communities in Probiotics+Vaccine (n = 10), Vaccine-only (n = 10), and Probiotics-only animals (n = 10). a, b Bacterial community richness (a) and evenness (b). Box and whisker bars represent 25–75 percentile and minimum and maximum number of observed OTUs. Black dots that overlay box and whisker plots represent the total number of observed OTUs for individual animals at each time point. Horizontal bars within each box represent the median. c Principal components analysis of beta-diversity. Probiotics+Vaccine animals are shown in blue, Vaccine-only in red, and Probiotics-only in green. Shaded ovals for each group represent data ellipses. d, e Relative abundance taxonomic plots of microbial phyla (d) and genera (e). Vertical colored bars represent the percentage of total sequences for specific phyla in individual animals at each of the indicated time points. f, g Smoothed mean relative abundance of bacterial phyla (f) and genera (g) at each of the indicated time points. Solid colored lines represent the mean abundance for specific bacterial phyla. Gray shading overlaying each colored line represents standard error bounds. Matched colored dots surrounding each colored line represent the specific abundances of each bacterial phyla or genera for individual animals. Pre-PBio baseline is an average of weeks −7 and −5, while Pre-Vax is week −2.

