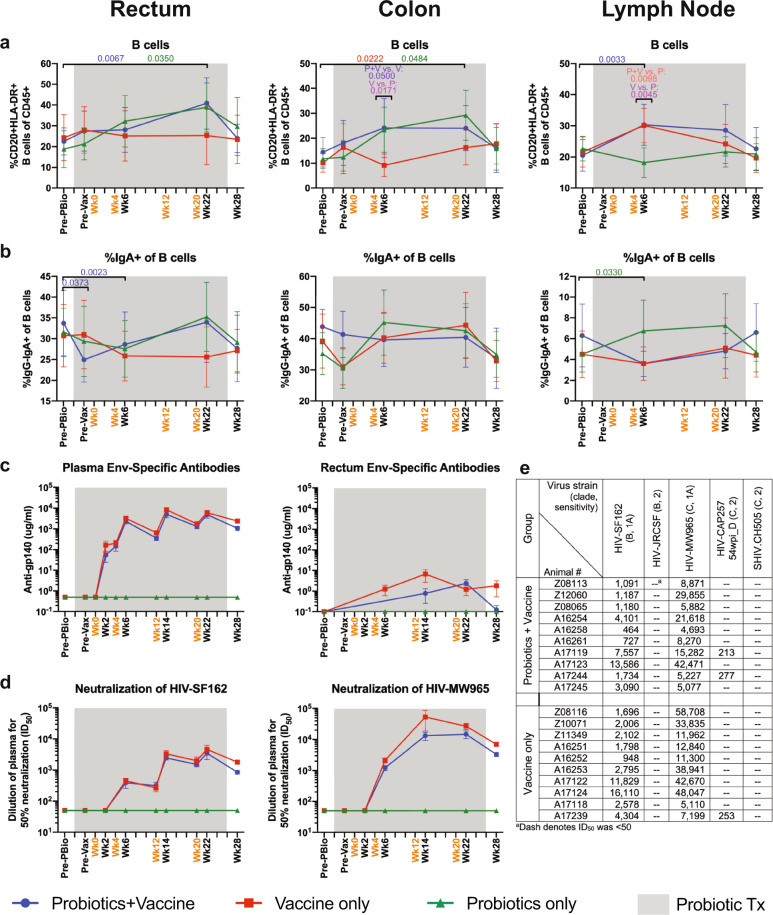
Fig. 8. B cell frequencies in mucosal and lymph node tissue and humoral immune responses during probiotic administration, SIV/HIV vaccination, or combination Probiotics+Vaccine.
Total CD20+HLA-DR+ B cells and IgA+ B cell frequencies were characterized in the rectum, colon, and lymph node of Probiotics+Vaccine (n = 10), Vaccine-only (n = 10), and Probiotics-only (n = 10) treated animals by flow cytometry. a Percentage of CD20+HLA-DR+ B cells of CD45+ leukocytes. b Percentage of IgA+ of B cells. c Mean plasma antibody titers (µg/ml) of Env-specific (gp140) binding antibodies in plasma and rectal secretions. d Dilution of plasma required to reach 50% neutralization (ID50) of HIV-SF162 and HIV-MW965. e Table of neutralization (ID50) of HIV-SF162, HIV-JRCSF, HIV-MW965, HIV-CAP257 54wpi_D, and SHIV.CH505 in Probiotics+Vaccine and Vaccine-only animals at peak response (week 22). In all panels, data are depicted as the mean and 95% confidence interval for each group: Probiotics+Vaccine = blue circles, Vaccine-only = red squares, Probiotics-only = green triangles. Pre-PBio baseline is an average of weeks −7 and −5, while Pre-Vax is week −2. Immunizations at weeks 0, 4, 12, and 20 are indicated in orange font. Daily oral probiotics were administered between week −5 and week 26, indicated by the gray bar. For comparisons within each group between Pre-PBio and subsequent time points, multiplicity adjusted significant P values are shown above horizontal black bars, with fonts colored to indicate the experimental group. For comparisons between groups at each time point, multiplicity adjusted significant P values are specified above the designated time point.

