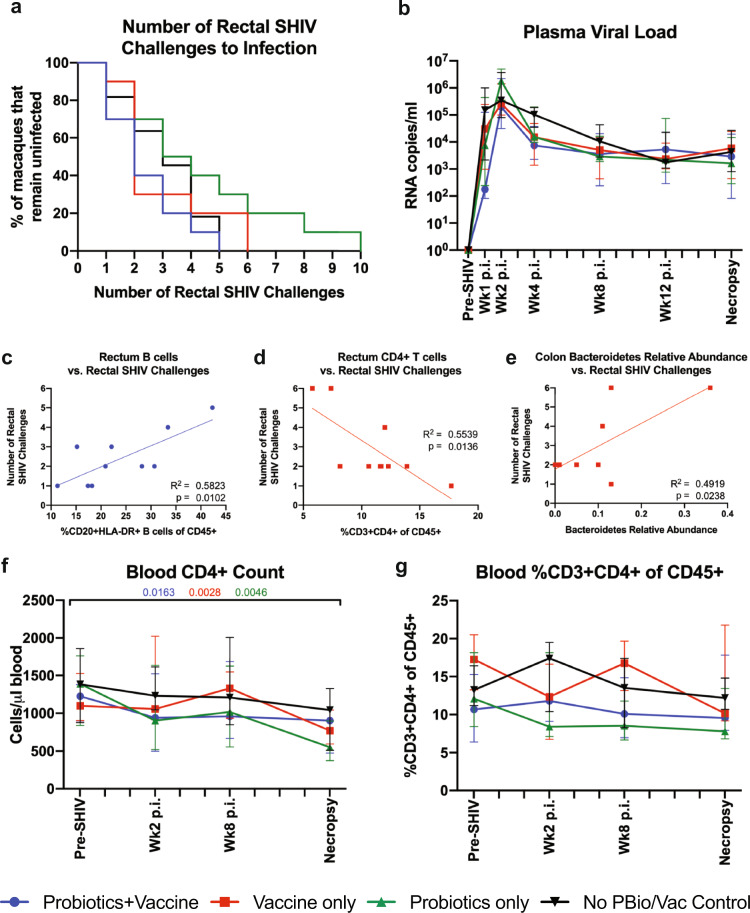
Fig. 9. SHIV.CH505 acquisition, post-infection viral kinetics, and peripheral CD4+ T cell counts between probiotic-treated, SIV/HIV vaccinated, and combination Probiotics+Vaccine-treated animals.
SHIV.CH505 infectivity rate, post-infection (p.i.) viral kinetics, and blood CD4+ T cell count and frequency were assessed in Probiotics+Vaccine (n = 10), Vaccine-only (n = 10), Probiotics-only (n = 10), and no Probiotics/no Vaccine controls (n = 11). a Survival curve showing the percentage of animals that remained uninfected after each rectal challenge. b Plasma viral loads (RNA copies/ml plasma). c, d Linear regressions between the rate of SHIV acquisition and the frequency of B cells in the rectum of Probiotics+Vaccine animals (c), the frequency of CD4+ T cells in the rectum of Vaccine-only animals (d), and the relative abundance of the Bacteroidetes phylum in the colon of Vaccine-only animals (e). f Absolute number of CD4+ T cells per µl of blood. g Percentage of CD3+CD4+ T cells of CD45+ leukocytes in whole blood. In all panels, colors indicate different groups: Probiotics+Vaccine = blue circles, Vaccine-only = red squares, Probiotics-only = green triangles. In b, f, and g, data are depicted as the mean and 95% confidence interval for each group. Data at Pre-SHIV time point is week 28 for Probiotics+Vaccine, Vaccine-only, and Probiotics-only, and an average of weeks −9, −7, and −4 for no Probiotics/no Vaccine control animals. For comparisons within each group between Pre-SHIV and subsequent time points, multiplicity adjusted significant P values are shown above horizontal black bars, with fonts colored to indicate the experimental group. R2 and P values are shown for each linear regression performed.

